

Most teams skip social media competitor analysis because it feels time-consuming to set up. The actual bottleneck is data collection, not the analysis. Once you have a repeatable system for pulling competitor data, the rest is straightforward.
This guide walks through the full process, from identifying which competitors to watch to turning the findings into content decisions.
Quick Answer
A social media competitor analysis is a structured review of what your competitors post, how their audience responds, and where gaps exist in their content strategy. The process has six steps: identify competitors, choose platforms, decide what to track, collect data, analyze findings, and act on the insights. Free tools like Octoparse handle data collection; the analysis itself takes a spreadsheet and about an hour.
Step 1: Identify Your Competitors
Start with a short list. Three to five direct competitors is enough for a first analysis. More than that and the process becomes unwieldy before you’ve built a workflow.
Direct competitors sell a similar product to a similar audience. If someone could choose them instead of you, they’re a direct competitor.
Indirect competitors target the same audience but with a different product or approach. They’re worth tracking because they’re competing for the same attention, even if not the same purchase.
How to find them:
- Search your main product keywords on Google and see which brands appear consistently
- Search those same keywords directly on Twitter, YouTube, and LinkedIn
- Ask your sales team which names come up most often in competitive deals
- Check which accounts your existing customers also follow
Once you have your list, confirm each competitor is actually active on social media. An account that posts twice a year doesn’t need to be on your tracking list.
Step 2: Choose Which Platforms to Analyze
You don’t need to cover every platform. Cover the ones where your competitors are most active and where your shared audience actually spends time.
Twitter/X is best for tracking content positioning, real-time responses to news, and how a brand talks about its product day to day.
YouTube is best for understanding long-term content strategy and, more importantly, what an audience actually thinks, because comment sections on YouTube are where users say things they would never put in a survey.
LinkedIn works well for B2B brands. Engagement here signals professional credibility rather than broad reach.
Instagram and TikTok are worth tracking for consumer brands where visual content and short-form video drive discovery. If competitor creator partnerships are part of the picture, see how to find TikTok influencers who fit your brand.
For most teams, starting with one or two platforms per competitor is the right call. You can expand once the process is running smoothly.
Step 3: Decide What to Track and How Often
Five metrics give you a complete picture without creating noise:
- Post frequency and timing: how much they’re investing and when they post
- Engagement rate: total interactions / follower count / post count. Benchmarks: Twitter ~0.5–1%, YouTube above 3% is strong
- Content type distribution: ratio of video, text, images, links
- Top-performing content themes: what topics drive the highest engagement
- Comment language: complaints, feature requests, competitor comparisons surfacing before they appear anywhere else
Most teams run a full analysis monthly and set up automated data collection to run weekly in the background.
Step 4: Collect the Data
| Method 1: Manual | Method 2: Octoparse Templates | Method 3: Octoparse MCP | Method 4: Social Media Platforms | |
| Best for | One-off check, 1–2 competitors | Recurring analysis, bulk data, raw exports | AI-assisted workflow, no manual setup | Dashboard reporting, daily monitoring |
| Data depth | Shallow, easy-to-miss data | Deep, complete raw records | Deep, same as Method 2 | Medium, aggregated summaries |
| Comment content | Partial, copy-paste only | Full text, exportable | Full text, exportable | Count only, no text |
| Historical data | Limited to the visible page | Customizable date range | Customizable date range | Limited to the subscription window |
| Auto-updates | Manual every time | Scheduled tasks available | AI-triggered on demand | Built-in monitoring |
| Cost | Free | Free tier available | Free tier available | $$99$$399+/month |
| Setup time | None | Under 10 minutes | Near zero (describe in plain language) | Learning curve, then fast |
Method 1: Manual Collection
Best for: A one-time competitive audit, 1–2 competitors, no budget for tools.
Manual collection works when you need a quick read on what a competitor is doing, and you’re not planning to repeat it regularly. Pick a time window (the past 30 days is a reasonable starting point), open each competitor’s account, and record what you see.
What to record for each competitor:
- Post frequency over the past 30 days (count the posts)
- The 5–10 posts with the highest visible engagement
- What those high-engagement posts have in common: topic, format, day of week
- 10–20 comments from their top-performing posts, noted manually
- Follower count, noted so you can calculate engagement rates
Limitations:
Platforms load content in reverse chronological order, so older posts require significant scrolling with no guarantee you’ll see everything. Running this for three competitors across two platforms adds up to a half-day of work, and doing it monthly means starting from scratch each time.
Manual collection is a starting point. If you find yourself repeating it, that’s a signal to move to Method 2.
Method 2: Octoparse Templates (No Code)
Best for: Teams that need complete raw data, multiple competitors, or plan to run the analysis more than once.
Octoparse pulls data directly from Twitter and YouTube without an API key or any code. You get every post, every comment, and every engagement metric in a structured spreadsheet you can analyze however you want.
Start collecting competitor data for free →
What You’ll Need
- An Octoparse account (free to create, no credit card required)
- Competitor Twitter account URLs (format:
https://x.com/username) - Competitor YouTube channel names or search keywords
- Your target date range
Collecting Twitter data:
The Twitter Scraper (by Account URL) template extracts a competitor’s full tweet history for any time range you define. Here’s what each row in the export will contain:
Output fields: Tweet Content, Posted Time, User Handle, Likes Count, Reposts Count, Replies Count, Views Count, Tweet URL
Steps:
1. Open the template. In Octoparse, go to Templates and search for “Twitter Scraper by Account URL.” Click “Try It.” The template loads in the cloud; nothing installs on your machine.
https://www.octoparse.com/template/twitter-scraper-by-account-url
2. Enter the competitor account URL. Paste the Twitter/X URL of the account you want to analyze (e.g., https://x.com/HubSpot). You can enter multiple accounts, one per line.
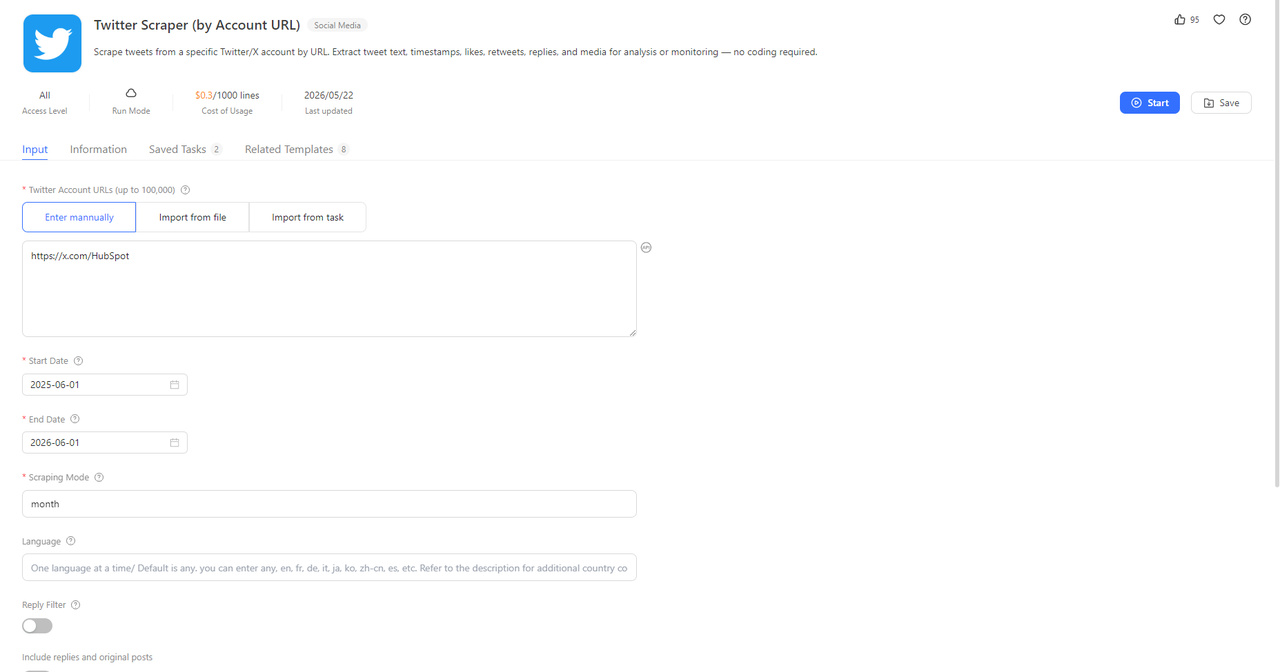
3. Run the task. Click Start. The task runs in the cloud, so you can close your browser.
4. Export. When the task finishes, click Export and choose CSV or Excel.
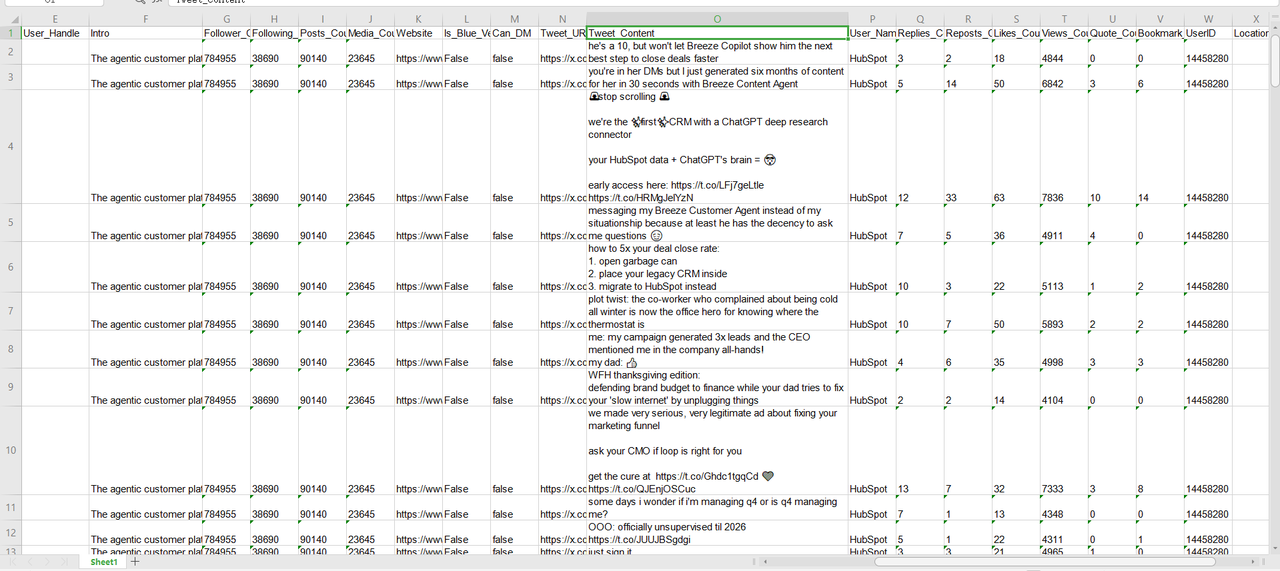
We tested this on HubSpot’s account over a 12-month window. The task completed in 1 minute 14 seconds and returned 69 tweets with no duplicates.
Tip: To track a competitor on a specific topic or campaign, use the Twitter Advanced Search Scraper instead. Filter by keywords, hashtags, and date range. Full guide: scrape Twitter competitor data.
Limitations: Only public accounts can be scraped. Private accounts return no data.
Collecting YouTube data (two-step):
YouTube requires two templates in sequence. The first pulls the video list; the second pulls comments.
Step 2A: Get the Video List
YouTube requires two templates in sequence. The first pulls the video list; the second pulls comments.
Output fields: Channel name, Subscriber count, Video count, Title, Video URL, Cover URL, Duration, View count, Date, Description
Steps:
1. Open the template. Search for “YouTube Channel Scraper (Free)” in Octoparse Templates.
https://www.octoparse.com/template/youtube-channel-scraper-free
2. Enter the competitor’s YouTube channel URL. Paste the channel URL directly (e.g., https://www.youtube.com/@HubSpot-CRM). You can find a channel’s URL by opening its YouTube page and copying it from the address bar.
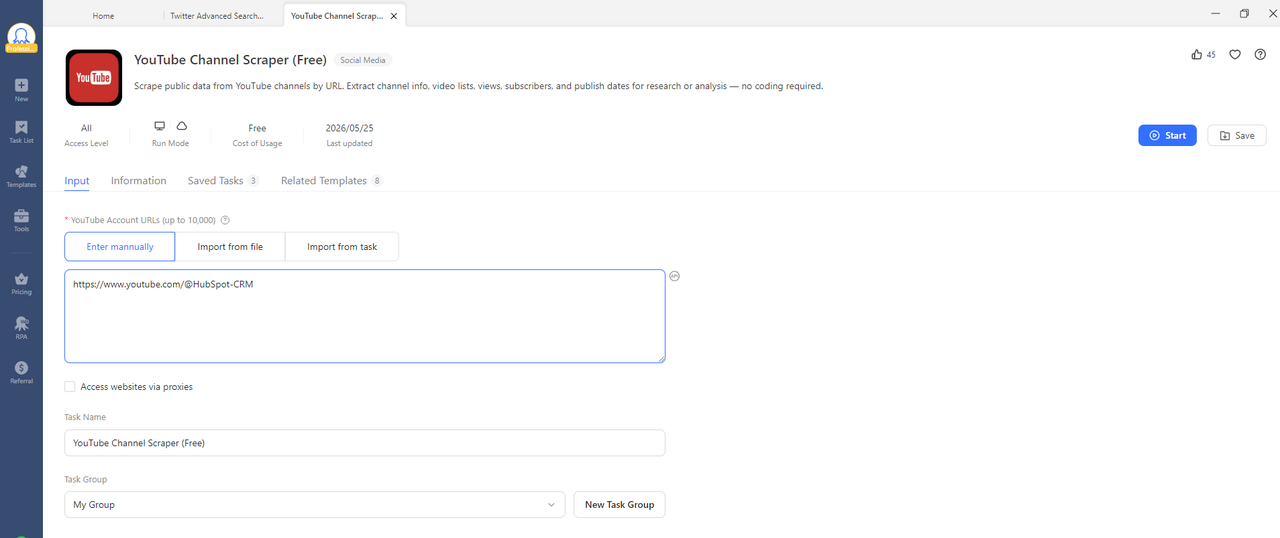
3. Run and export. Click Start. The task runs in the cloud. When complete, export as CSV or Excel and keep the Video URL column; you’ll paste these into Step 2B.
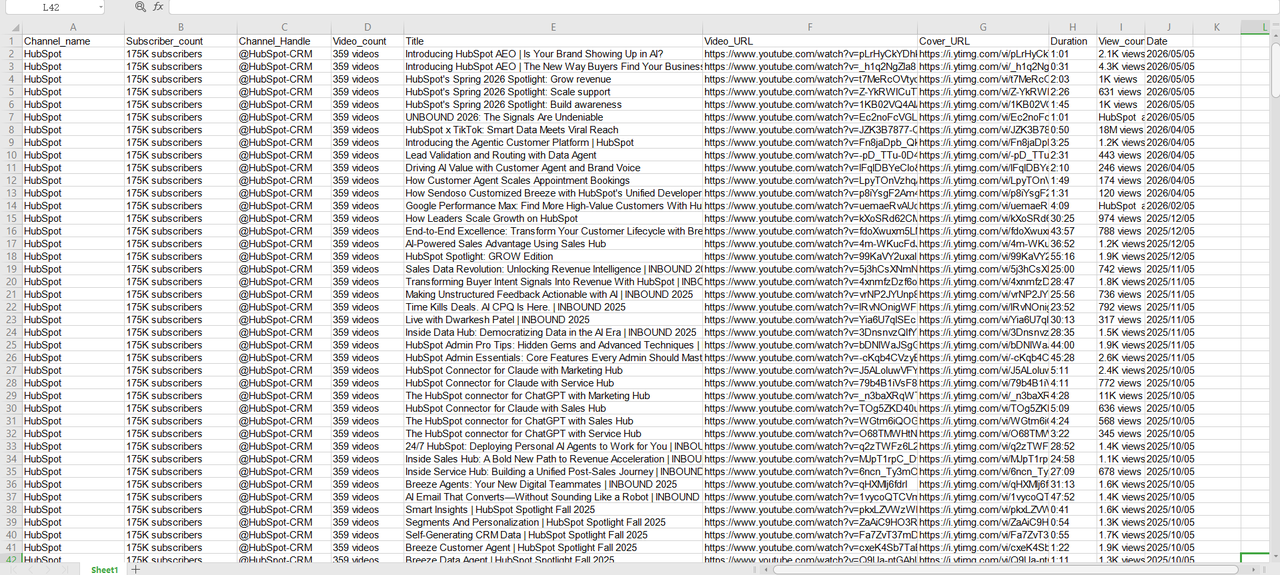
We ran this on HubSpot’s YouTube channel. The task returned 364 videos in 4 minutes 24 seconds with no failed URLs.
Step 2B: Get Video Comments
The YouTube Comments & Replies Scraper takes a list of video URLs and returns full comment text for each video.
Output fields: video URL, comment user, content, comment time, like count, reply user, reply content, post comment count
Steps:
1. Open the template. Search for “YouTube Comments & Replies Scraper” in Octoparse Templates.
https://www.octoparse.com/template/youtube-comments-replies-scraper
2. Import video URLs from the previous task. Click “Import from task,” select the YouTube Channel Scraper (Free) task you ran in Step 2A, then choose Video_URL as the field. The URLs load automatically, no manual copy-paste needed.
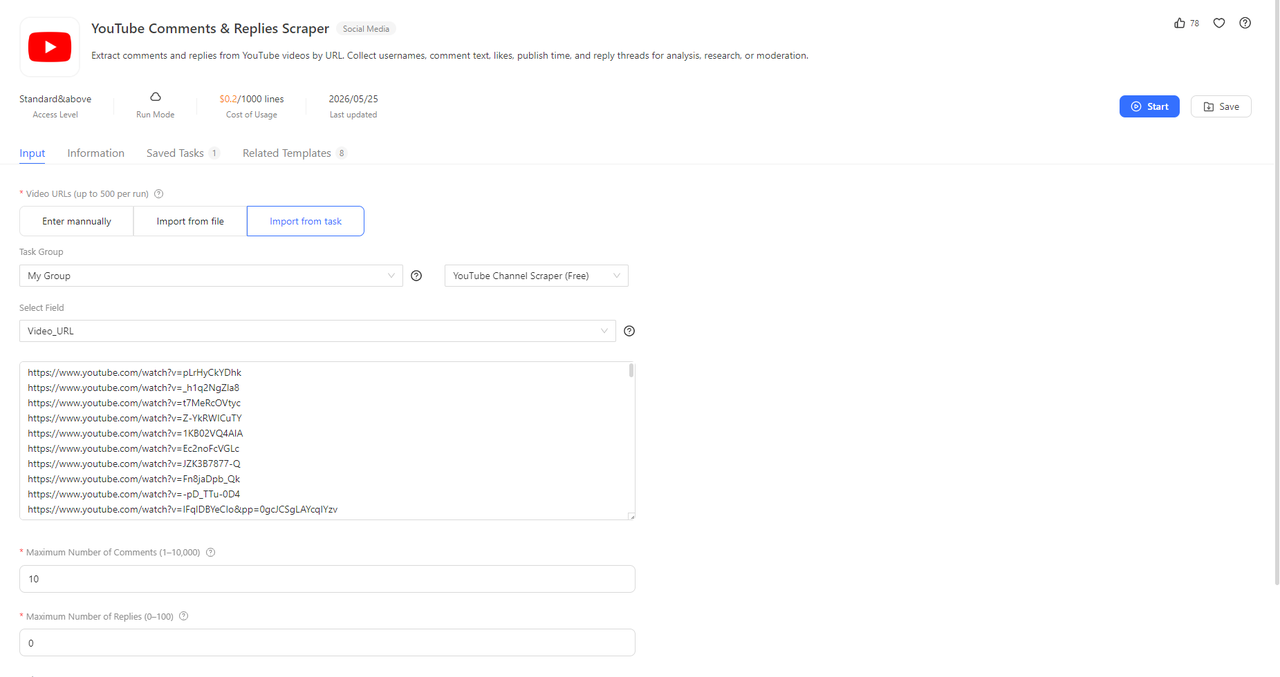
3. Run and export.
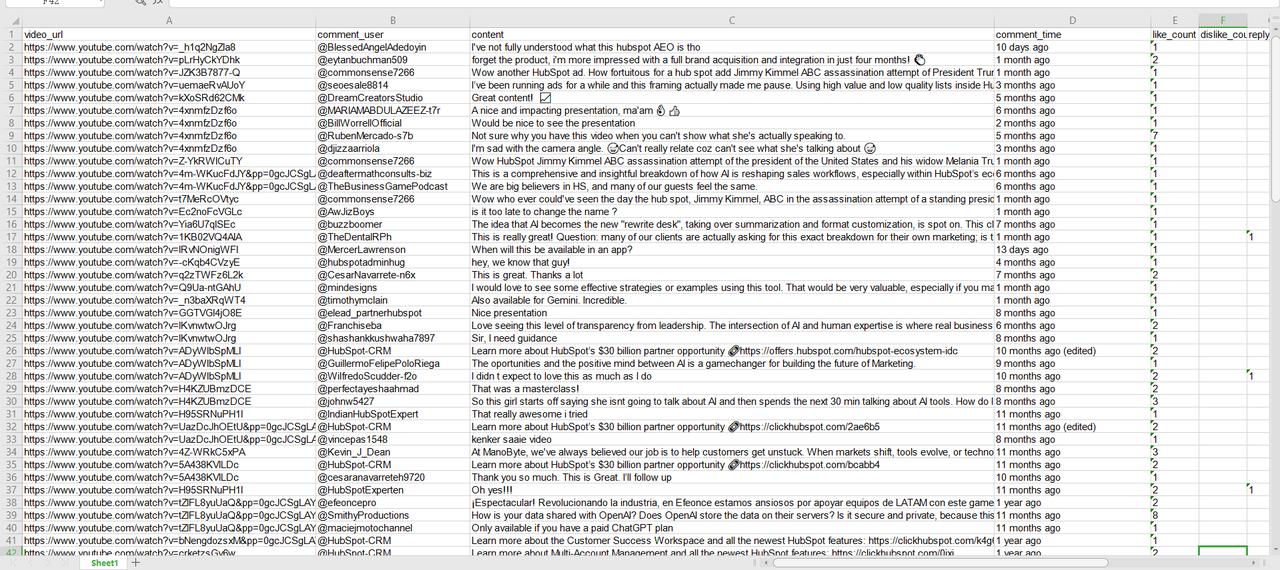
We tested this on 10 HubSpot videos with 10 comments each. The task returned 124 comments in 1 minute 21 seconds with no duplicates.
Limitations: The scraper returns the most recent comments up to your limit. To filter by time period, do it after export.
Setting up recurring runs: Both templates support scheduled tasks. In task settings, choose weekly or monthly, and Octoparse will run automatically and update your export.
Method 3: Let AI Run Your Analysis (Octoparse MCP)
Best for: Teams already working in AI assistants like Claude, ChatGPT, or Cursor who want to trigger data collection without switching tools or configuring templates manually.
Octoparse MCP connects your AI assistant directly to Octoparse’s scraping engine through the Model Context Protocol. Instead of opening Octoparse and filling in template fields, you describe what you need in plain language, and the AI handles template selection, parameter configuration, and workflow sequencing automatically.
How to set it up:
- Go to Octoparse MCP and follow the one-time setup guide for your AI assistant (Claude, ChatGPT, Cursor, or any MCP-enabled client)
- Connect your Octoparse account
- Start describing what you want to collect in plain language
If you haven’t connected your AI assistant to Octoparse MCP yet, these setup guides walk you through the process:
- How to Connect Octoparse MCP to Claude
- Turn ChatGPT into an AI Web Scraper with Octoparse MCP
- Let Cursor AI Extract Web Data Using Octoparse MCP
Example prompt:
“Use Octoparse to scrape tweets from @HubSpot between June 2025 and June 2026. Use the Twitter Scraper by Account URL template with scraping mode set to month.”
The AI selects the template, fills in the account URL, date range, and scraping mode, then runs the task and returns a preview of the results directly in the conversation.
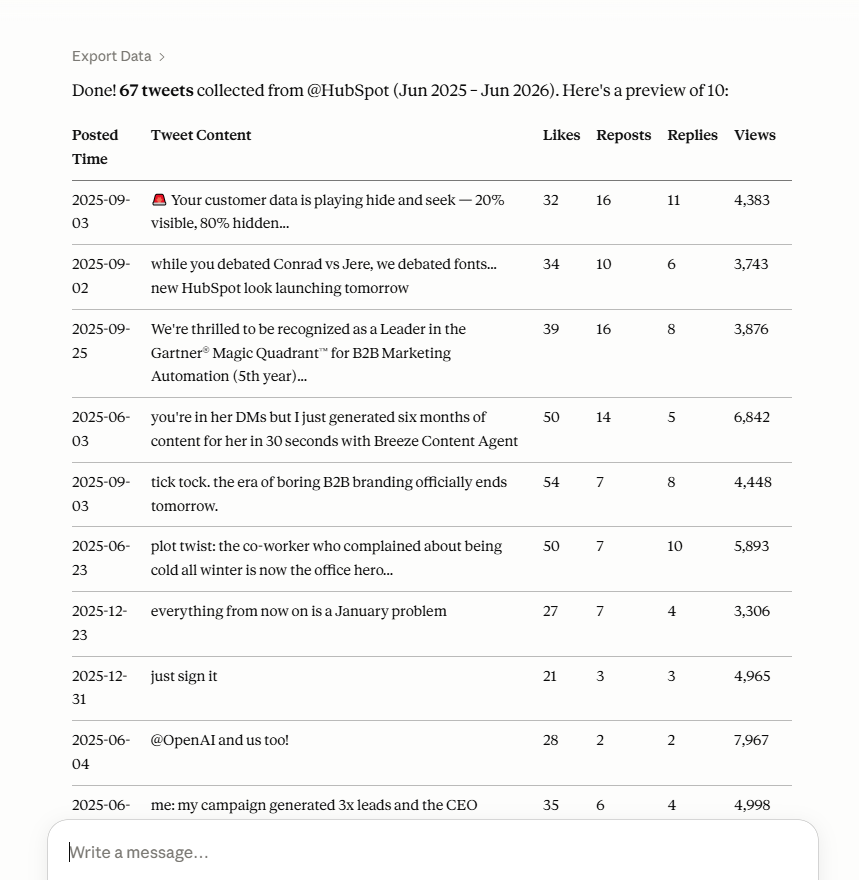
What you can ask for:
- “Get all tweets from @HubSpot between May and June 2026”
- “Pull the full video list from HubSpot’s YouTube channel”
- “Scrape comments from these 10 YouTube videos” (paste URLs)
- “Run the Twitter scraper and YouTube channel scraper for HubSpot in one go”
What you’ll get: The same complete raw data as Method 2, delivered directly inside your AI conversation. Export to CSV or Excel from the same interface.
Limitations: Works only with AI assistants that support MCP (Claude, ChatGPT, Cursor, and similar tools).
Method 4: Social Media Management Platforms
Best for: Teams that need visual dashboards, daily monitoring, and standardized reports for stakeholders.
Sprout Social and Hootsuite both include competitor analysis in their paid plans. Sprout Social’s competitor reporting is available from the Professional tier at $299/seat/month. Hootsuite includes competitor benchmarking from its Advanced plan at $399/month, covering up to 20 competitor profiles with customizable reports.
Where these platforms work well:
- Visual dashboards that non-technical stakeholders can read without opening a CSV
- Integration with publishing and scheduling, so analysis and execution stay in the same tool
- Out-of-the-box competitor reports that require no data manipulation
Limitations:
Both platforms report aggregated numbers: averages, totals, trend lines. The underlying post-level and comment-level data stays locked inside the platform. If you need comment language to find product gaps, or a competitor’s full posting history for a custom attribution model, these platforms reach their limit. Historical data is also restricted to your subscription start date.
One practical combination: use Octoparse for quarterly deep-dive data pulls, and a social media platform as a competitor monitoring tool for the ongoing dashboard in between. For a broader comparison, see our breakdown of competitor analysis tools.
Step 5: Analyze Your Findings
Sort by engagement rate, not raw numbers. Calculate engagement rate for each post and sort descending. Look at the top 10 results: what topic, format, and timing do they share? A consistent pattern across the top posts is a real signal.
Run a quick SWOT per competitor.
| Positive | Negative | |
| Internal | Strengths: what they do consistently well | Weaknesses: where their content underperforms or audiences push back |
| External | Opportunities: topics or formats they ignore that your audience wants | Threats: angles where they’re outperforming you |
Read the comments for unmet needs (Options B and C only). In your comment export, search for feature requests (“I wish it could…”), competitor comparisons (“I switched from…”), and frustration language (“why doesn’t this…”). This is where content gaps surface before they show up in any metric.
Build a benchmark table. One row per competitor: Platform, Avg Engagement Rate, Posts/Week, Top Format, Top Topic. Add your own account. Update monthly.
Avg engagement rate = (likes + reposts + replies) / posts / followers × 100
Let AI do the analysis. When you use Octoparse MCP, the data stays in the conversation. Once the scraping task completes, ask Claude or ChatGPT to analyze the results directly:
“Calculate the average engagement rate across these tweets, identify the top 10 by engagement rate, and summarize what topics and formats they share.”
“From these YouTube comments, identify the most common user complaints, feature requests, and competitor mentions.”
No exporting, no spreadsheet, no formulas. Collection and analysis happen in one conversation.
Step 6: Turn Insights Into Action
Three outputs from Step 5 become three decisions here:
Content gaps → Topics your competitors ignore but their audience asks about in comments are pre-validated opportunities. Add them to your content calendar.
Posting cadence → If a competitor posts consistently on a platform and gets strong results, match or beat their frequency on that platform specifically.
Format gaps → If their video content outperforms text by a wide margin, test the same format on your account before drawing conclusions.
Conclusion
A social media competitor analysis doesn’t have to be a large project. The six steps above break it into manageable pieces: identify who to watch, pick one or two platforms, decide what to track, collect the data, analyze the findings, and act on what you learned.
The hardest part for most teams is keeping it consistent. Manual collection works once but doesn’t hold up as a monthly habit. Setting up Octoparse templates or an MCP workflow takes under 10 minutes and means the data is ready when you are, without repeating the setup each time.
Start with one competitor on one platform. Run the analysis, fill in the benchmark table, and identify one thing worth testing. That’s a complete cycle. Once the process feels routine, adding more competitors or platforms is straightforward.
Turn website data into structured Excel, CSV, Google Sheets, and your database directly.
Scrape data easily with auto-detecting functions, no coding skills are required.
Preset scraping templates for hot websites to get data in clicks.
Never get blocked with IP proxies and advanced API.
Cloud service to schedule data scraping at any time you want.
FAQs About Social Media Competitor Analysis
1. How often should I run a social media competitor analysis?
Most teams run a full analysis monthly. Octoparse supports scheduled tasks, so once the workflow is set up, you can have it run automatically, and the data will be waiting for you. A complete manual analysis takes too long to do weekly, but automated data collection with weekly exports is realistic.
2. What’s the difference between social media competitor analysis and social listening?
Social listening tracks all public mentions of your brand or industry keywords across the web. Competitor analysis focuses on what specific competitors publish and how their audience responds. The two approaches complement each other. For more on collecting Twitter data for either use case, see our guide on Twitter scraping vs Twitter APIs.
3. Can I run this analysis for TikTok or Instagram?
Yes. Octoparse has TikTok templates, including the TikTok Video Details Scraper and TikTok Video Comments Scraper. The workflow is similar to the YouTube chain: get a video list, then pull details and comments. Instagram is more restrictive due to the platform’s anti-scraping measures. It works, but expect lower reliability. Test with a small batch before running a full analysis.
4. Is collecting public social media data legal?
Collecting publicly visible data, including posts, engagement counts, and public comments, is legal in most jurisdictions. U.S. courts have consistently held that scraping public web content does not violate the Computer Fraud and Abuse Act. The boundary is clear: public posts and comments are fair game; private accounts, login-gated content, and direct messages are off limits. Check each platform’s terms of service for the specific language they use.
5. Is there a template I can use to organize my findings?
The benchmark table in the analysis section works as a starting structure: Competitor / Platform / Average Engagement Rate / Posts per Week / Top Content Topic. One row per competitor, one for your own account. Copy it into Google Sheets and update it each time you run the analysis.