

Source: Zillow August Market Report; observed August 2026 values.
Zillow’s September publications are forecasts and CPI shelter projections, so this article keeps observed August results separate from forward-looking estimates.
The latest snapshot points to a split market: more homes are available, but elevated mortgage rates are slowing sales; meanwhile, rents are growing faster than home values and are absorbing some demand from buyers who remain on the sidelines.
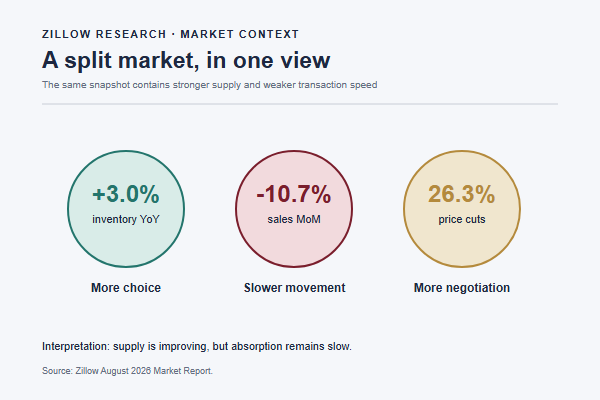
Sources: Zillow August Market Report, Zillow August Rent Report, and Zillow September 2026 Forecast; retrieved October 3, 2026. Forecasts are labeled separately from observed August data.
Zillow housing market statistics: quick answer
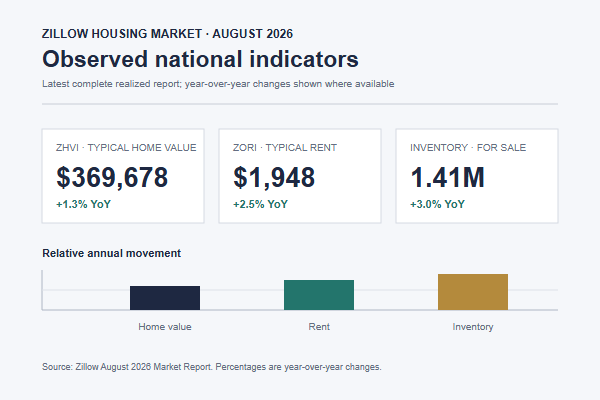
Zillow’s latest complete realized national report covers August 2026. The typical home value was $369,678, typical rent was $1,948, and homes for sale reached 1.41 million. The headline is mixed: supply increased, while Zillow’s homes-sold nowcast fell 10.7% month over month. Zillow’s September outlook is forward-looking: it forecasts 1.2% ZHVI growth for 2026 and a 3.5% year-over-year decline in fourth-quarter existing-home sales.
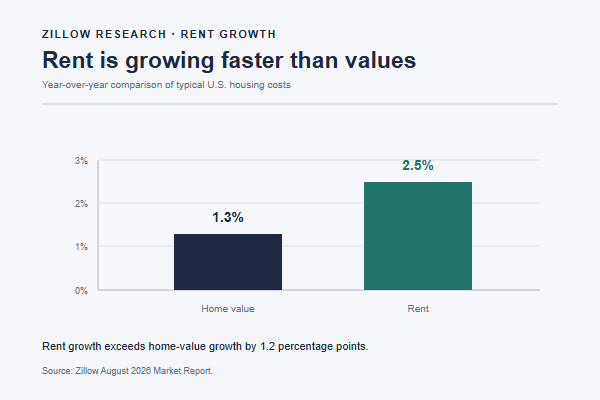
- Home values: $369,678 typical ZHVI, up 1.3% year over year.
- Rent: $1,948 typical ZORI, up 2.5% year over year.
- Supply: 1.41 million homes for sale, up 3.0% year over year.
- Sales pace: 339,927 homes sold in Zillow’s nowcast, down 10.7% from July.
Latest Zillow statistics at a glance
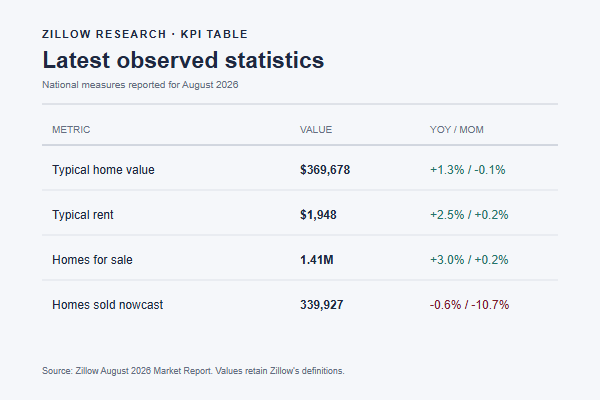
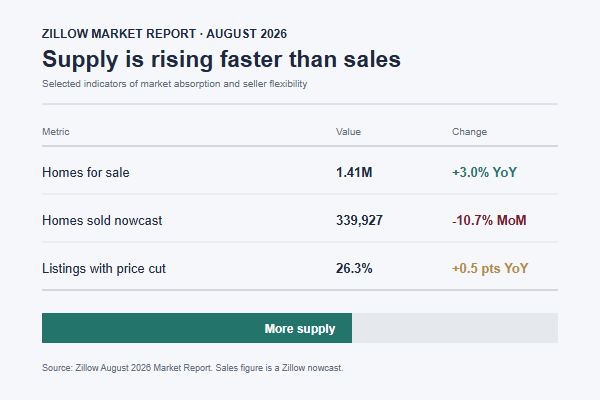
Source: Zillow August Market Report; figures are national observed metrics.
Data visualization source: Zillow Research; values match this section.
| Metric | Latest observed result | Change or status |
| Typical U.S. home value (ZHVI) | $369,678 | +1.3%; -0.1% |
| Typical U.S. rent (ZORI) | $1,948 | +2.5%; +0.2% |
| Homes for sale | 1.41 | +3.0%; +0.2% |
| Homes sold, Zillow nowcast | 339,927 | -0.6%; -10.7% |
| Newly pending listings | Not reported | -2.6% |
| Median time to pending | 27 | +2 |
| Listings with a price cut | 26.3% | +0.5 |
| Rental listings with a concession | 39.2% | +2.5 |
| Typical mortgage payment | $1,897 | +2.0% |
The observed figures above come from Zillow’s August report. The sales count is a Zillow nowcast and can be revised as reporting data arrives.
Home values are rising slowly while sales weaken
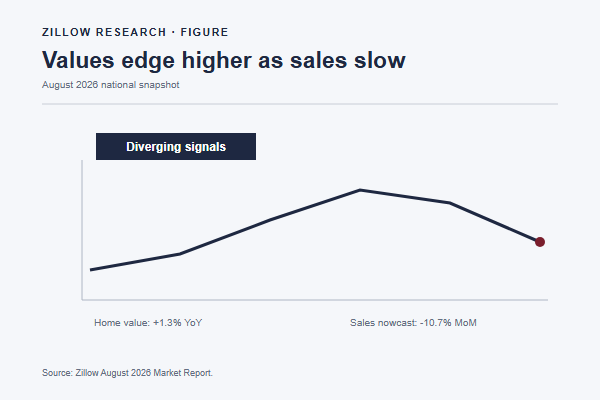
Data visualization source: Zillow Research; values match this section.
According to the Zillow Home Value Index (ZHVI), the typical U.S. home value was $369,678 in August. It was 1.3% higher than a year earlier, but fell 0.1% from July. The typical monthly mortgage payment was $1,897, including estimates for taxes, insurance, and maintenance, and was 2% higher than a year earlier.
The sales side was weaker. Zillow estimated 339,927 homes sold in August, down 0.6% year over year and 10.7% from July. Newly pending listings, a forward-looking demand signal, fell 2.6% year over year. Zillow linked the slowdown to mortgage rates remaining above 6.5% during the period covered by the report.
This combination matters: prices can still be positive year over year even while transaction activity contracts. A home-value index measures the value of a typical home, while sales counts measure completed market activity; they answer different questions.
Inventory is the clearest buyer-side improvement
Data visualization source: Zillow Research; values match this section.
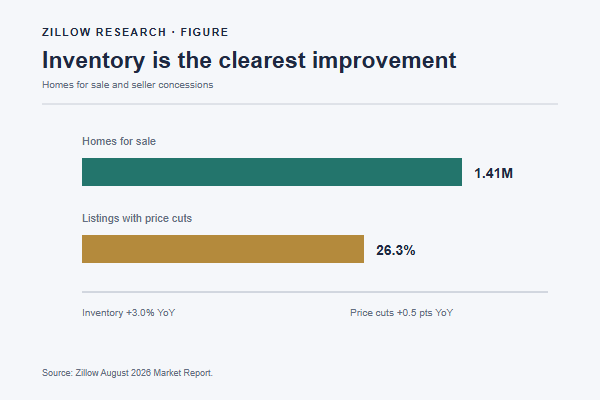
Zillow recorded 1.41 million homes for sale in August, 3% more than a year earlier and 0.2% more than July. New for-sale listings totaled 356,934, up 2.4% year over year but down 7.9% from July.
More available homes give buyers more choice, but the additional supply has not translated into faster sales. Homes took a median of 27 days to go pending, unchanged from a year earlier and two days longer than July. The share of listings with a price cut reached 26.3%, half a percentage point above last year.
Together, these figures describe a market with more negotiating room than a supply-constrained boom. They do not prove that every buyer has leverage: local inventory, property type, and price band still determine the experience.
Rent growth is outpacing home-value growth
Source: Zillow August Rent Report; comparison uses Zillow stated mortgage assumptions.
Data visualization source: Zillow Research; values match this section.
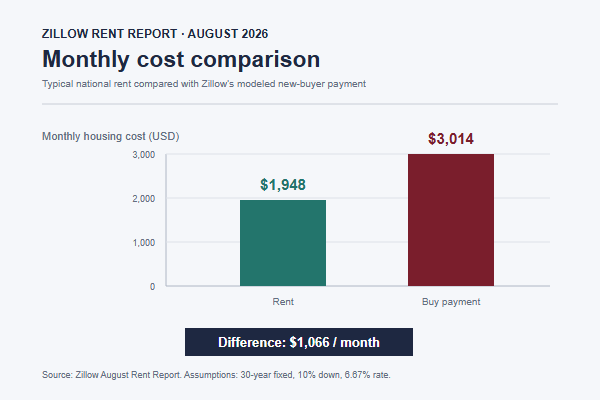
The Zillow Observed Rent Index (ZORI) placed typical U.S. rent at $1,948 in August, up 2.5% year over year and 0.2% from July. Zillow’s August Rent Report found that renting was cheaper than buying in all 50 of the largest U.S. metros. The typical renter paid $1,066 less per month than the typical new buyer, a difference of $12,792 per year under Zillow’s stated assumptions.
Rent affordability was not uniform. A median-income household would spend 26.6% of income on a new rental in August. Zillow estimated that the income needed to afford the typical rent rose 2.6% year over year to $77,919. New York was the least affordable large metro at 40.6%, while Austin, Raleigh, and Salt Lake City were each at 18.3%.
The gap between rent and ownership is a modeled comparison, not a universal financial recommendation. Zillow assumes a 30 year fixed mortgage, 10% down, a 6.67% rate, and estimated taxes and insurance.
What the latest forecast says about the rest of 2026
Data visualization source: Zillow Research; values match this section.
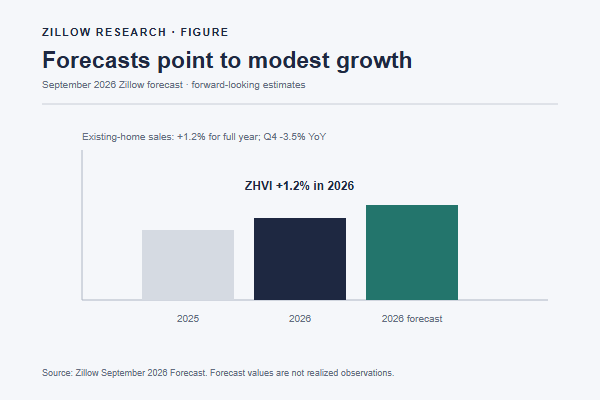
Zillow’s September 2026 forecast expects existing-home sales to decline 3.5% year over year in the fourth quarter, while total 2026 sales still finish 1.2% above 2025. Its year-end forecast calls for 1.2% ZHVI growth, 3.766 million existing-home sales on Zillow’s count, 2.9% single-family rent growth, and 1.7% multifamily rent growth.
The latest September CPI shelter forecast projects 2026 rent inflation of 2.87% and owner-equivalent rent growth of 3.21%. It also revised expected 2026 on-market rent growth to 3.1% and 2.2%.
These are forecasts, not August outcomes. They reflect Zillow’s current model assumptions and may change with mortgage rates, inflation, employment, and new housing supply.
How to interpret these Zillow statistics
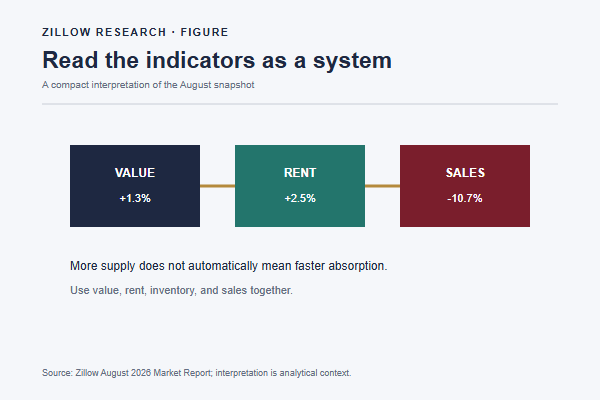
Data visualization source: Zillow Research; values match this section.
For buyers, the most actionable signals are the 1.41, 26.3%, and 27 to pending. These indicators suggest more room to compare listings and negotiate than in a fast seller’s market.
For sellers, the -0.6% and the rise in price cuts suggest that pricing and market positioning matter. A national 1.3% does not guarantee that an individual listing will appreciate or sell quickly.
For renters, the 2.5%, 39.2% concession rate, and $1,066 show why effective monthly cost matters more than headline rent alone. Concessions, taxes, insurance, maintenance, and financing assumptions should be recorded separately when comparing markets.
How to collect Zillow data for a reproducible analysis
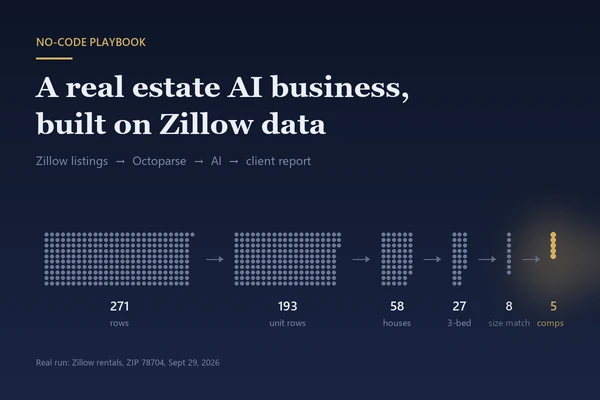
A Zillow market-statistics article is easier to trust when the collection method preserves the same geography, property type, date, and source URL across every observation. Octoparse is a web data platform that can support this workflow in three layers: use the Templates Gallery when a maintained Zillow extraction template fits the question, use Octoparse Desktop to author a custom point-and-click workflow when the page structure or fields differ, and use Octoparse Cloud when the collection needs scheduled execution. The API and MCP server can run approved templates or tasks and retrieve results; they do not automatically author a reusable task.
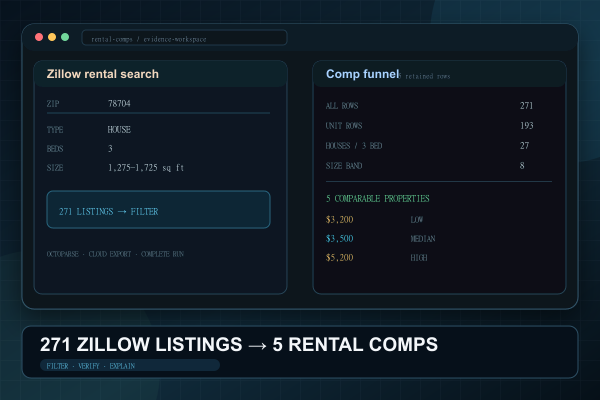
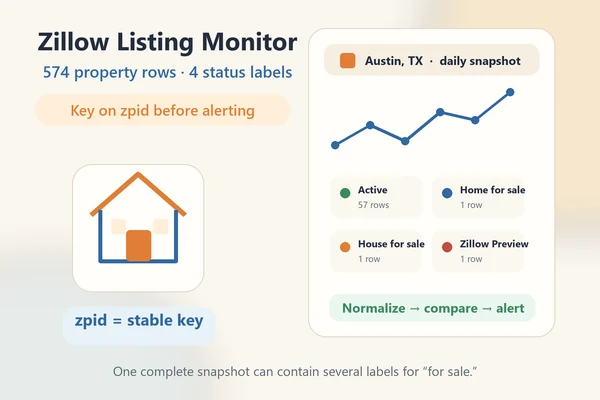
For a rental-comps workflow, keep zpid, address, listing status, asking rent, bedrooms, bathrooms, square footage, latitude, longitude, listing URL, and collection timestamp as separate fields. Deduplicate by zpid or canonical listing URL before calculating medians. Store realized Zillow indices such as ZHVI and ZORI separately from listing-level snapshots, because they answer different questions and use different denominators. A reproducible run should also record the filters, page count, collection date, and any missing-field rule.
See the related rental comps workflow, real-estate AI workflow, and Zillow listing-monitor guide for adjacent use cases. Those pages cover operational collection patterns; this article remains the reference for the national statistics and their definitions.
Methodology and limitations
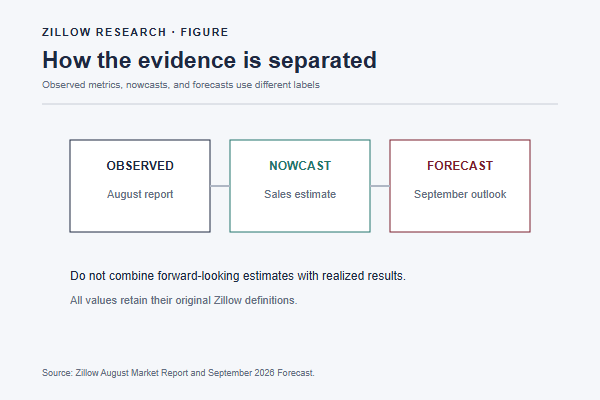
Data visualization source: Zillow Research; values match this section.
This article uses Zillow’s latest complete realized market report available on October 3, 2026: the August 2026 Market Report. ZHVI measures the typical value of homes in the 35–65 percentile range. ZORI is a repeat-rent index designed to control for changes in the mix of rental homes.
The sales count is a preliminary Zillow nowcast and may be revised. The September forecast and CPI shelter figures are model outputs, not realized market totals. Metro values describe the markets covered by Zillow and should not be treated as neighborhood valuations. The rent-versus-buy comparison depends on Zillow’s stated financing and cost assumptions.
For a reproducible Zillow data collection workflow, preserve the geography, property type, listing status, price or rent, collection date, and source URL for every record. Do not mix a current listing snapshot with ZHVI or ZORI time-series values without labeling the difference.
FAQs about Zillow Housing Market Statistics
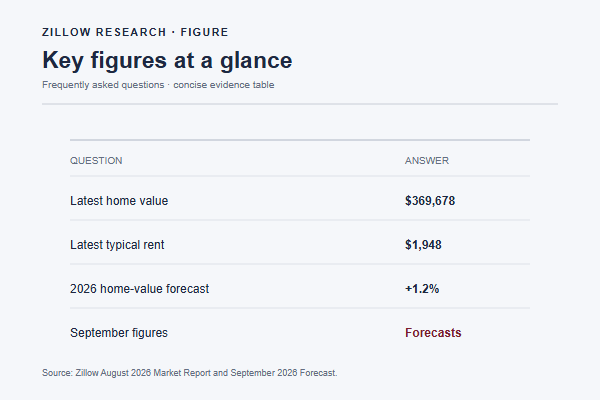
Data visualization source: Zillow Research; values match this section.
What is the latest Zillow home-value figure?
The latest complete realized Zillow market report available on October 3, 2026 reports a typical U.S. home value of $369,678.
What is the latest Zillow rent figure?
The typical U.S. rent was $1,948, up 2.5%.
Is Zillow predicting a housing-market recovery?
Zillow’s September forecast expects total 2026 sales to finish 1.2%, but it also expects fourth-quarter sales to decline 3.5%. The outlook is therefore mixed rather than a simple recovery story.
Which Zillow metrics should not be combined?
Keep ZHVI, ZORI, listing snapshots, and Zillow’s sales nowcast in separate fields. They use different populations and update schedules, so combining them into one average can create a misleading trend.
Are September 2026 Zillow numbers actual or forecast?
The September Zillow pages available by October 3 are forecasts, including the September housing forecast and CPI shelter forecast. The latest full realized market snapshot is August 2026.