Most Temu price trackers read one number from the product page. That number is the price of one variant, it says nothing about stock, and the “sold” label next to it is a rounded, all-time figure.
We wanted to see how much that misses, so we took one day of Temu data from two storefronts and looked at it the way a pricing team would. The data comes from the same pipeline behind our managed Temu data feeds, and you can download all of it below.
TL;DR
- The headline price is one variant’s price. In the UK sample, the cheapest and most expensive variants of the same product differed by 29% at the median.
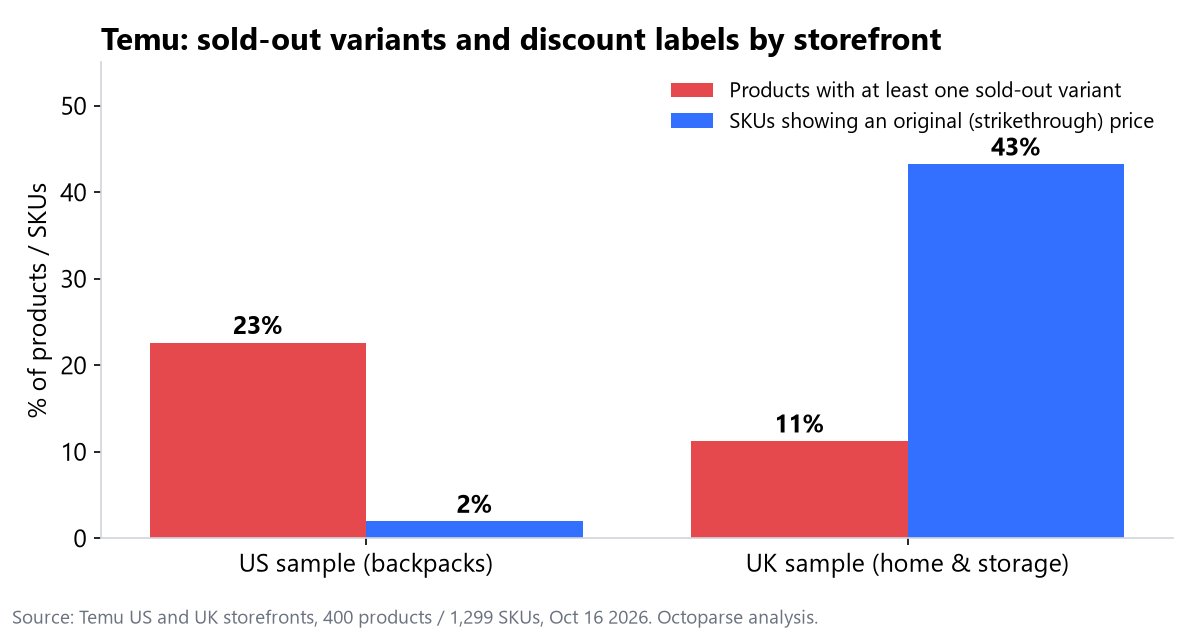
- Listings stay live while variants sell out. 23% of US products had at least one sold-out color or size, and 13% had half or more sold out.
- Discount labels behave differently by storefront. 43% of UK SKUs showed an original price; only 2% of US SKUs did.
- “Sold” labels are rankings, not sales figures. They are rounded and cumulative, so velocity needs repeated snapshots.
Key finding: In an Octoparse analysis of 1,299 Temu SKUs collected on October 16, 2026, 23% of US products had at least one sold-out variant while the listing stayed live, and in the UK sample the cheapest and most expensive variants of the same product differed by 29% at the median.
What data did we look at?
400 Temu products and their 1,299 variants (SKUs), collected from public product pages on October 16, 2026:
| Storefront | Products | SKUs | Categories |
|---|---|---|---|
| United States (USD) | 200 | 774 | Women’s backpacks, casual unisex backpacks |
| United Kingdom (GBP) | 200 | 525 | Lighting, storage and home organisation |
For each product we have the title, category, sale price, original price, the sales label, rating count and shop. For each SKU we have its options (color, size, bundle), its own price and original price, whether it is on sale or sold out, and the shipping fee.
One thing to keep in mind: the two storefronts cover different categories here, so treat the US and UK numbers as “what these categories look like”, not as a comparison of the two markets.
The full dataset is public on Hugging Face and Kaggle, and you can rerun every number in this notebook.
Is the Temu product page price the real price?
Only for one variant. Temu prices each color and size separately, and the page shows one of them up front.
Of the products with more than one variant, 109 of 144 in the US sample and 56 of 65 in the UK sample sold those variants at different prices. In the UK home and storage listings, the gap between a product’s cheapest and most expensive variant was 29% at the median. The US backpacks were tighter, around 7%, because most colors of a bag cost about the same.
That 29% matters. If you track a competitor’s headline price and compare it with your best-selling size, you can be comparing two different products without knowing it.
How often do Temu listings show sold-out variants?
More often than the product page suggests.
| US sample | UK sample | |
|---|---|---|
| SKUs marked sold out | 12.5% | 5.5% |
| Products with at least one sold-out variant | 23% | 11% |
| Products with half or more variants sold out | 13% | 9% |
The clearest example in the data is a US travel backpack. The listing shows “4K+ sold”, a price of $29.66 and an add-to-cart button. Five of its six colors are sold out.

For a seller competing with that listing, this is useful. When a rival’s popular colors run out, you don’t need to match their price for a few days. You only see it if you collect availability for each variant.
Want this view of your own competitors? We can pull a free Temu sample with variant-level price and stock for the products you name.
Do Temu discounts look the same everywhere?
No. In this sample the two storefronts behave almost the opposite way.
| UK sample | US sample | |
|---|---|---|
| SKUs showing an original (strikethrough) price | 43% | 2% |
| Median discount where one is shown | 15% | 45% |
In the UK home and storage categories, a strikethrough price is the norm and the discounts are modest. In the US backpack listings it is rare, but when it does appear the gap is wide.
The practical point: a discount rule that works on one storefront, such as “flag any competitor more than 20% off”, will behave very differently on another. Check what the data actually looks like in each storefront before you set thresholds.
What do Temu “sold” numbers actually mean?
They are rounded, all-time display labels such as “214 sold”, “7.3K+” or “67K+ sold”. They are not monthly sales.
Converted to numbers (taking the lower bound of “K+”), the median product in both samples showed about 1,000 sold. 16.5% of the UK products showed 10,000 or more, against 0.5% of the US backpacks.
That is enough to rank products inside a category. It is not enough to tell you what sold last week. For that you need to collect the same products on a schedule and compare the snapshots.
What this means if you track Temu prices
Five things we would do differently after looking at this data:
- Collect at the SKU level. Price, original price and stock all live on the variant.
- Write down which price you mean. Headline, cheapest variant or a specific variant. Mixing them makes every comparison unreliable.
- Track availability alongside price. A sold-out variant is a competitive signal in its own right.
- Treat “sold” labels as rankings. Use repeated snapshots for anything time-based.
- Set rules per storefront. Discount display and price spread differ by storefront and category.
How we collect Temu data at scale
Temu has no public API for catalog or competitor data, and it blocks automated traffic quickly. The data here came from the same managed pipeline we run for clients through our Temu data scraping service: product and SKU records with defined fields, checked for duplicates and broken product-variant links before delivery. At full scale the same approach delivers more than 8 million records a month, as described in our Temu pricing pipeline case study.
If you also watch Amazon, Walmart or Shopee, our price monitoring feeds put them in one schema next to Temu.
Methodology
- Source: public product pages on the Temu US and UK storefronts.
- Collection time: October 16, 2026 (US 09:31-12:58, UK 16:05-16:21, UTC+8).
- Sample: 400 products and 1,299 SKUs; two categories per storefront.
- Processing: values kept as displayed; prices parsed from text; discount = 1 – selling price / original price, only where the original price is higher; “K+” sales labels converted to their lower bound.
- Reproduce it: dataset and notebook.
FAQs about Temu price data
Can I track Temu price history?
Temu doesn’t show price history on the product page. You build it by collecting the same products on a schedule and storing each snapshot with its capture time.
How often do Temu prices change?
Often enough that daily collection is the usual starting point for competitor tracking, with more frequent runs during big promotions. Variant availability can change within the same day.
Is the Temu “sold” count accurate?
It is a rounded, cumulative display value. It’s useful for ranking products, not for exact or recent sales.
Can I get Temu data for other countries?
Yes. Each country storefront has its own prices and currency, and they can be collected in the same schema. Coverage is confirmed per project.