If you have ever scrolled a “100 winning products” listicle and launched one of them, you already know how this ends. By the time a product appears on a public list, hundreds of other sellers have seen the same list. The margin is gone before your first ad runs.
The sellers who consistently find winning products do not read more lists. They look at the same raw data the lists are built from: marketplace best-seller rankings and social trend signals. This guide shows you how to do exactly that, step by step, without writing code.
What Is a Winning Product?
A winning product is a product with proven, growing demand and a supply side that has not yet caught up. In practice, it sits at the overlap of three signals:
- Demand: people are already buying it. Best-seller rankings prove purchases, not just interest.
- Momentum: demand is rising, not flat. A product climbing a Best Sellers chart beats one sitting at #1.
- Headroom: competition has not saturated. Review counts, ad volume, and seller counts are still low relative to demand.
Most product research fails because it checks only one signal. A viral TikTok proves attention, not purchases. A high Amazon rank proves purchases, but a rank that has been stable for three years usually means entrenched competitors. You need demand, momentum, and headroom together, and that requires tracking data over time rather than glancing at it once.
Why Amazon Best Sellers + TikTok Is the Strongest Signal Pair
Amazon Best Sellers and TikTok measure opposite ends of the product lifecycle, which is exactly why they work together.
Amazon Best Sellers measures realized demand. Amazon updates its Best Sellers rankings frequently based on actual sales. When a product climbs from #80 to #25 in a subcategory over two weeks, real customers paid real money. No survey or ad-spy tool gives you that certainty.
TikTok measures pre-purchase attention. Trends often show up in TikTok views and hashtag activity weeks before they show up in marketplace rankings. A product gaining millions of views under a niche hashtag, while still ranking low on Amazon, is the classic early signal.
Read together, the two sources answer the question every dropshipper actually cares about: is this product about to take off, already peaking, or already crowded?
| Signal combination | What it means | What to do |
| TikTok rising, Amazon rank low | Early-stage trend | Test fast, small budget |
| TikTok rising, Amazon rank climbing | Validated momentum | Strongest entry window |
| TikTok flat, Amazon rank high and stable | Mature market | Enter only with differentiation |
| TikTok declining, Amazon rank slipping | Fading trend | Skip |
The problem is that neither source hands you this data in a usable form. Amazon shows rankings as web pages with no history. TikTok shows view counts inside an app. To compare anything over time, you need the data in a spreadsheet, refreshed on a schedule. That is a web scraping job, and it is the part most sellers get stuck on.
How to Find Winning Products Step by Step
This walkthrough uses Octoparse, a no-code scraping platform with prebuilt templates for both Amazon Best Sellers and TikTok. The free plan covers up to 50,000 rows per month, which is far more than this workflow needs. You can substitute other tools, but the method stays the same: extract, schedule, compare, validate.
Step 1. Pull a full Amazon Best Sellers snapshot for your niche
Open the Amazon Best Sellers Scraper (by Category) template. Pick a main category from the dropdown (40 categories are available, from Pet Supplies to Beauty), then select the subcategories you want to monitor.
https://www.octoparse.com/template/amazon-best-sellers-scraper-by-category
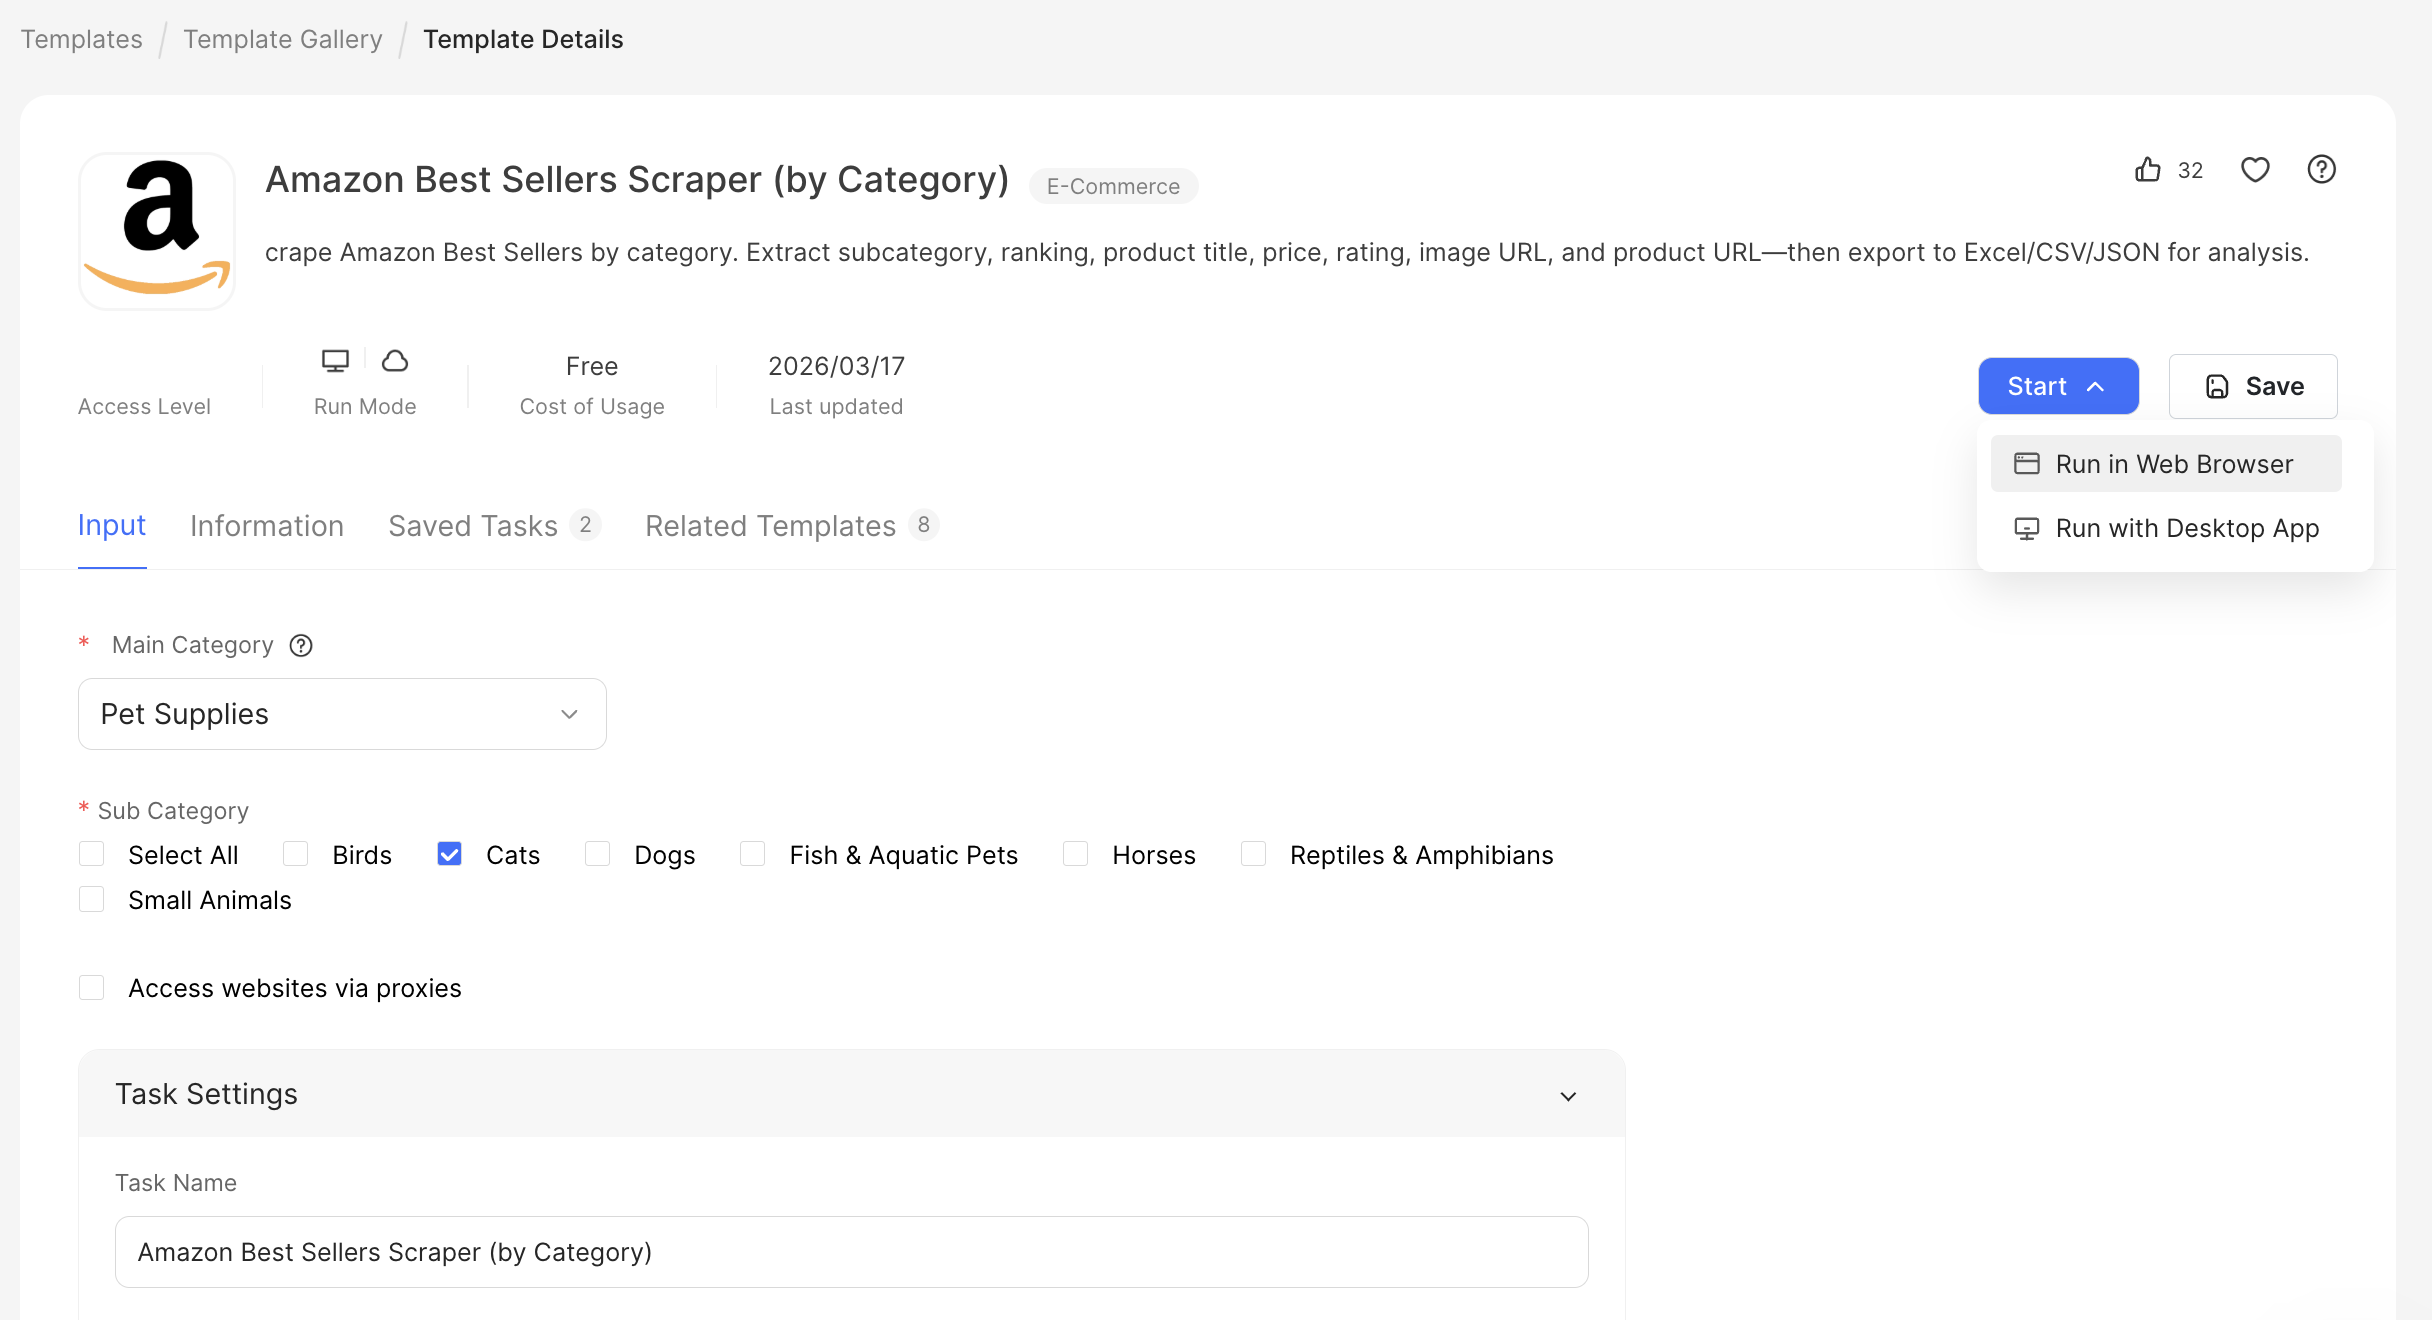
The template runs in the cloud and returns, for every ranked product: subcategory, ranking position, product title, price, rating, image URL, and product URL. Export it to Excel, CSV, or JSON.
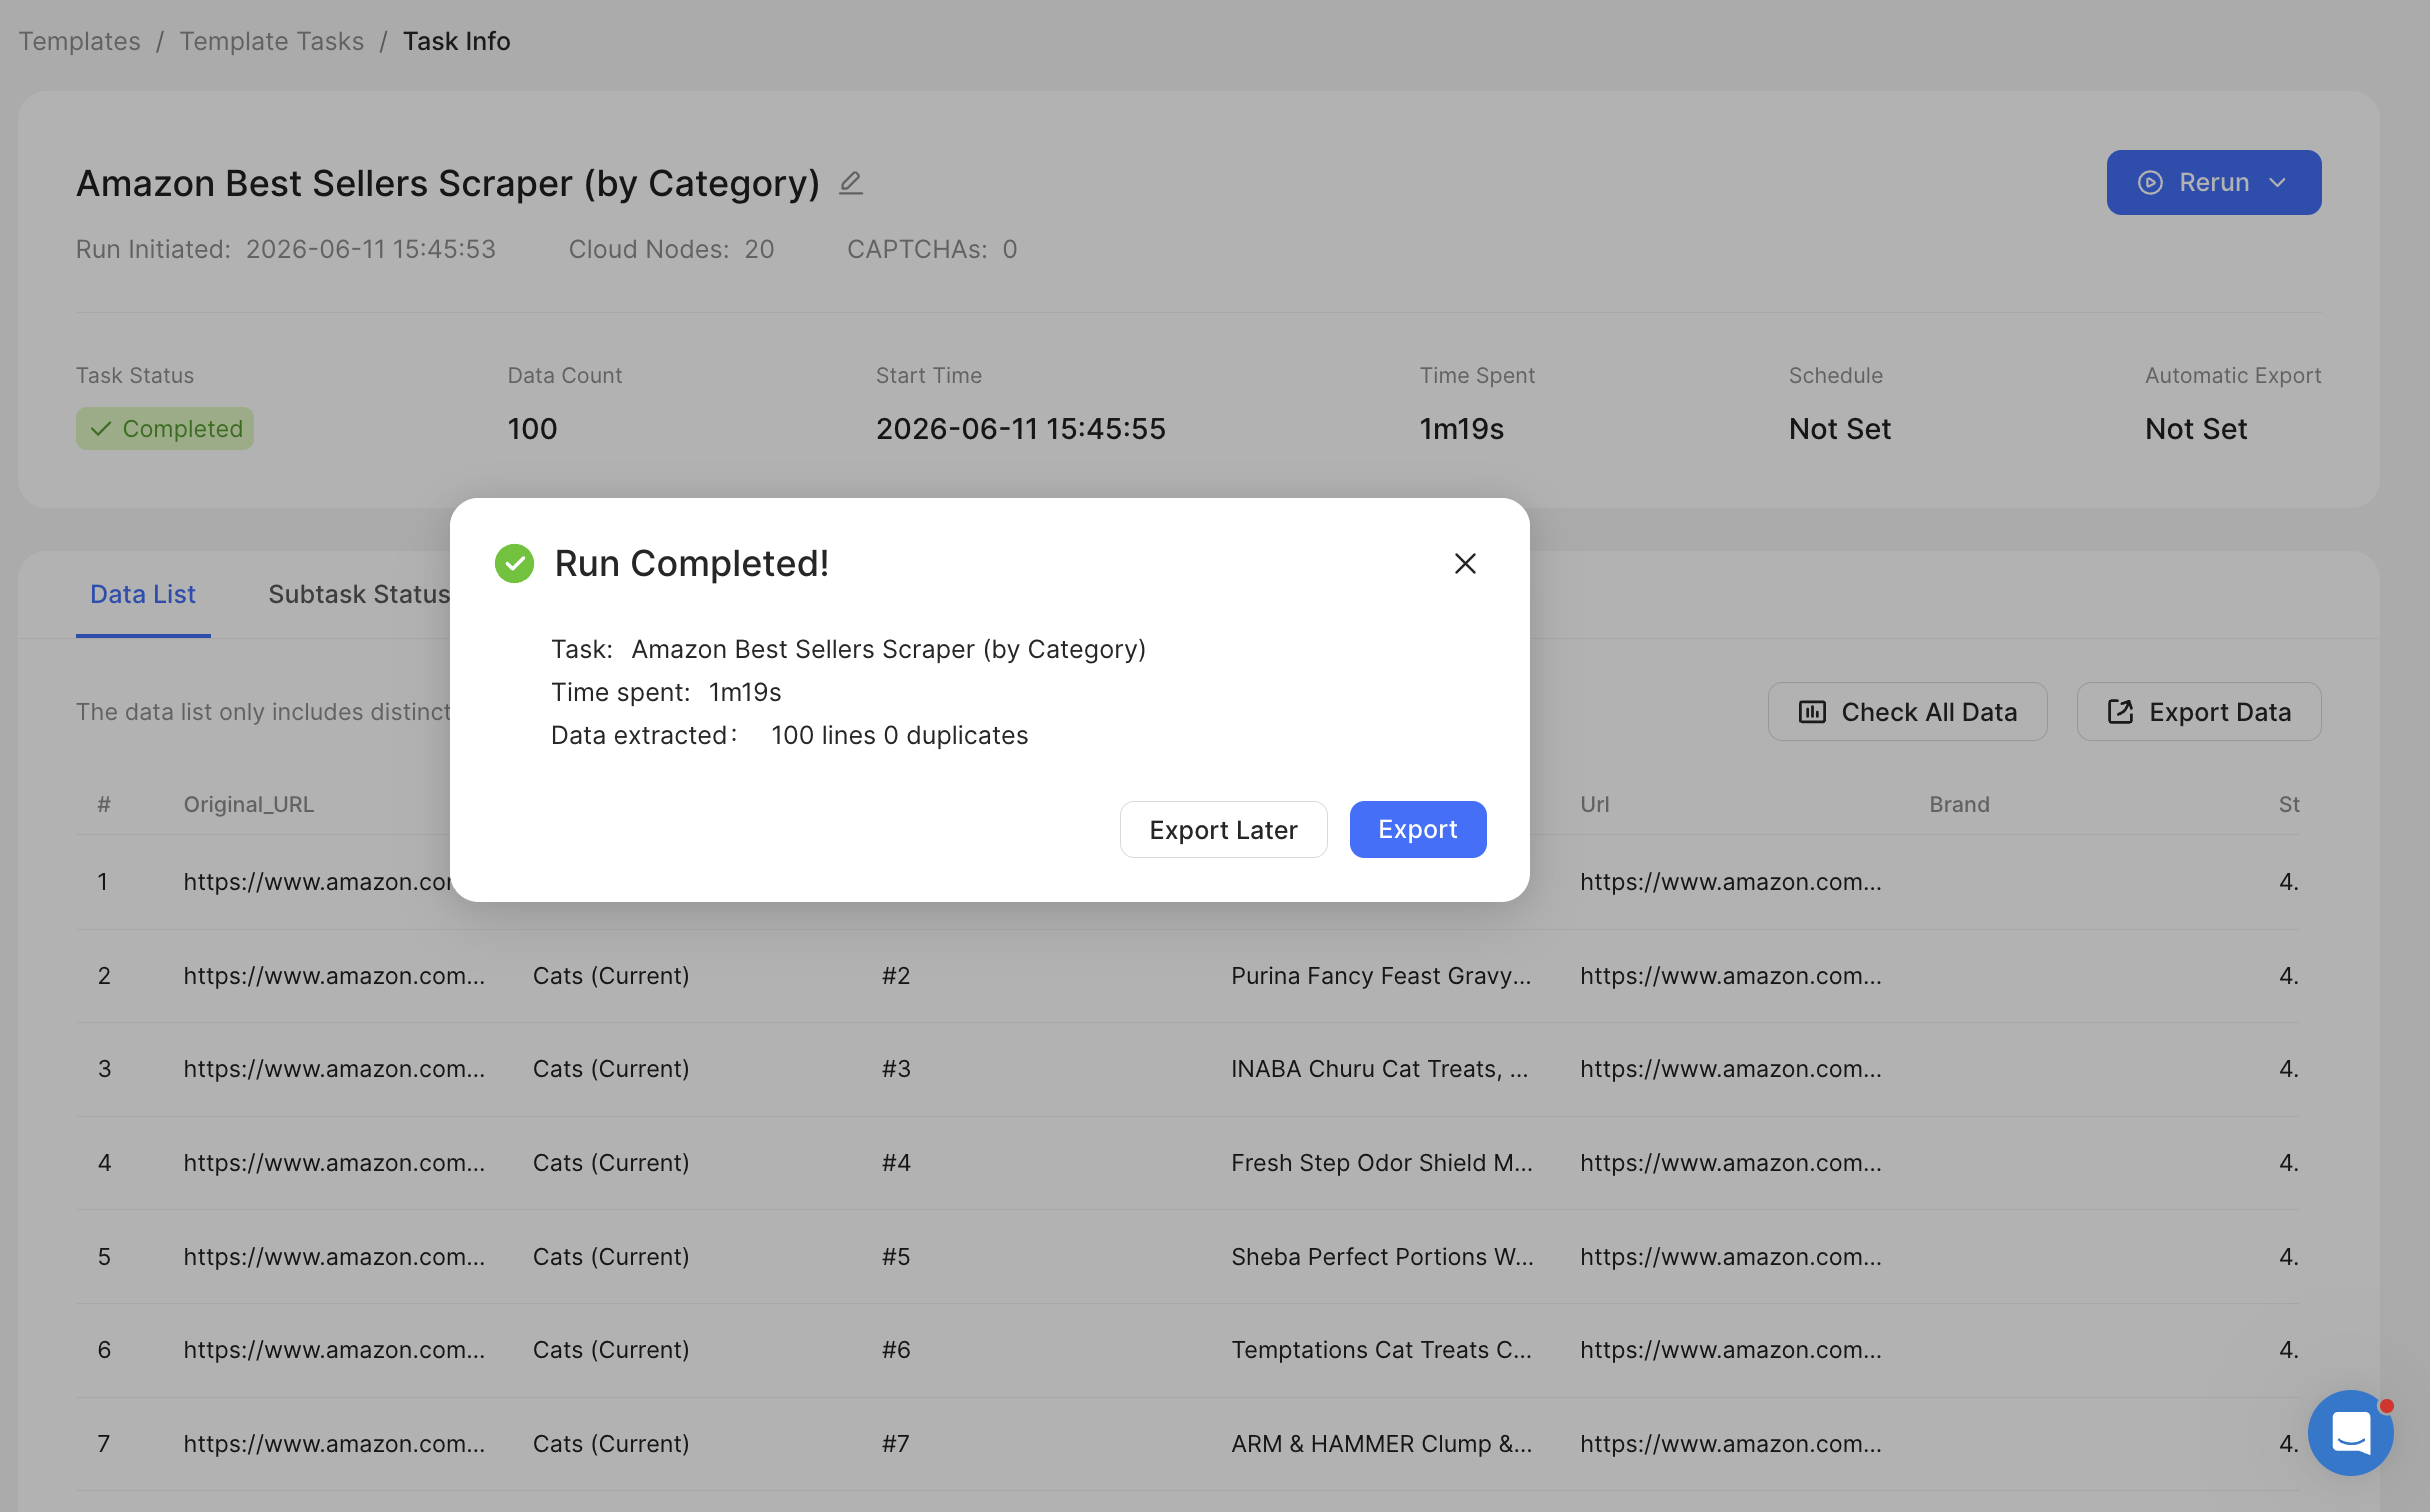
One run gives you a snapshot: every best-selling product in your niche, with its exact rank, in one sheet. That alone replaces hours of manual browsing. But a snapshot is only the baseline. The signal lives in the change.
Step 2. Schedule cloud runs and track rank movement
Set the same task to run on a schedule in the cloud, daily or every few days depending on how fast your niche moves. Each run produces a new dated snapshot.
Now you can compute the metric that public listicles never show you: rank delta. Join two snapshots on product URL and subtract the rankings. Products that jumped 20 or more positions in a week are your momentum candidates. Products that held a top-10 rank across every snapshot are your saturated incumbents.
A simple spreadsheet formula handles the comparison, or you can hand both files to an AI assistant and ask it to list the biggest climbers. Either way, you are no longer guessing which products are “trending.” You are measuring it.
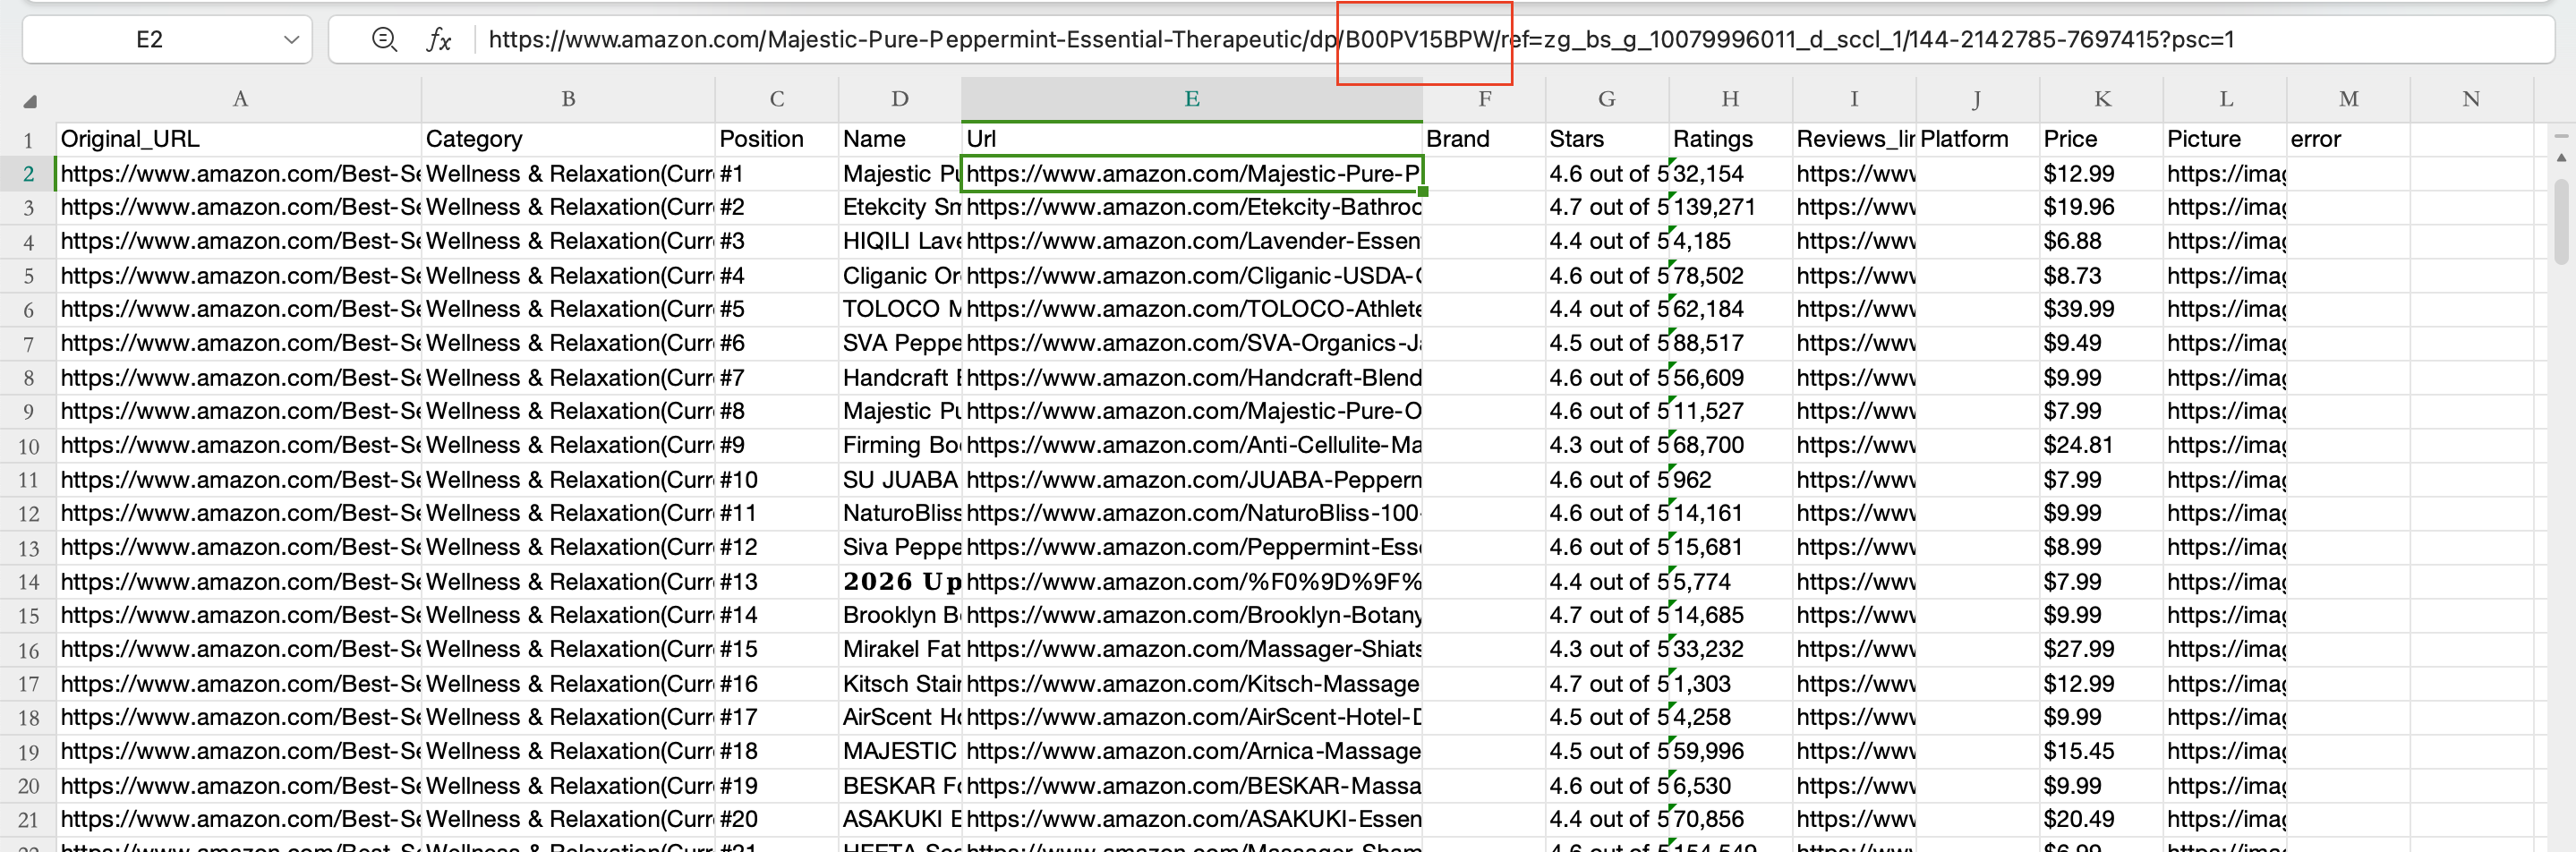
One practical gotcha when you join the snapshots: on Amazon, the product URL carries a session code that changes every scrape, so the same product looks like a different link each day. Match on the ASIN instead (the fixed 10-character ID right after /dp/ in the URL). Match on the raw URL and the same product gets counted as a new one each day, so nothing appears to climb.
A real example: one week of Wellness & Relaxation
To show what this surfaces, we ran exactly this method on the Amazon Best Sellers template ranking for Wellness & Relaxation, capturing the full top 100 every day for six days (June 17 to 22) and comparing snapshots by ASIN.
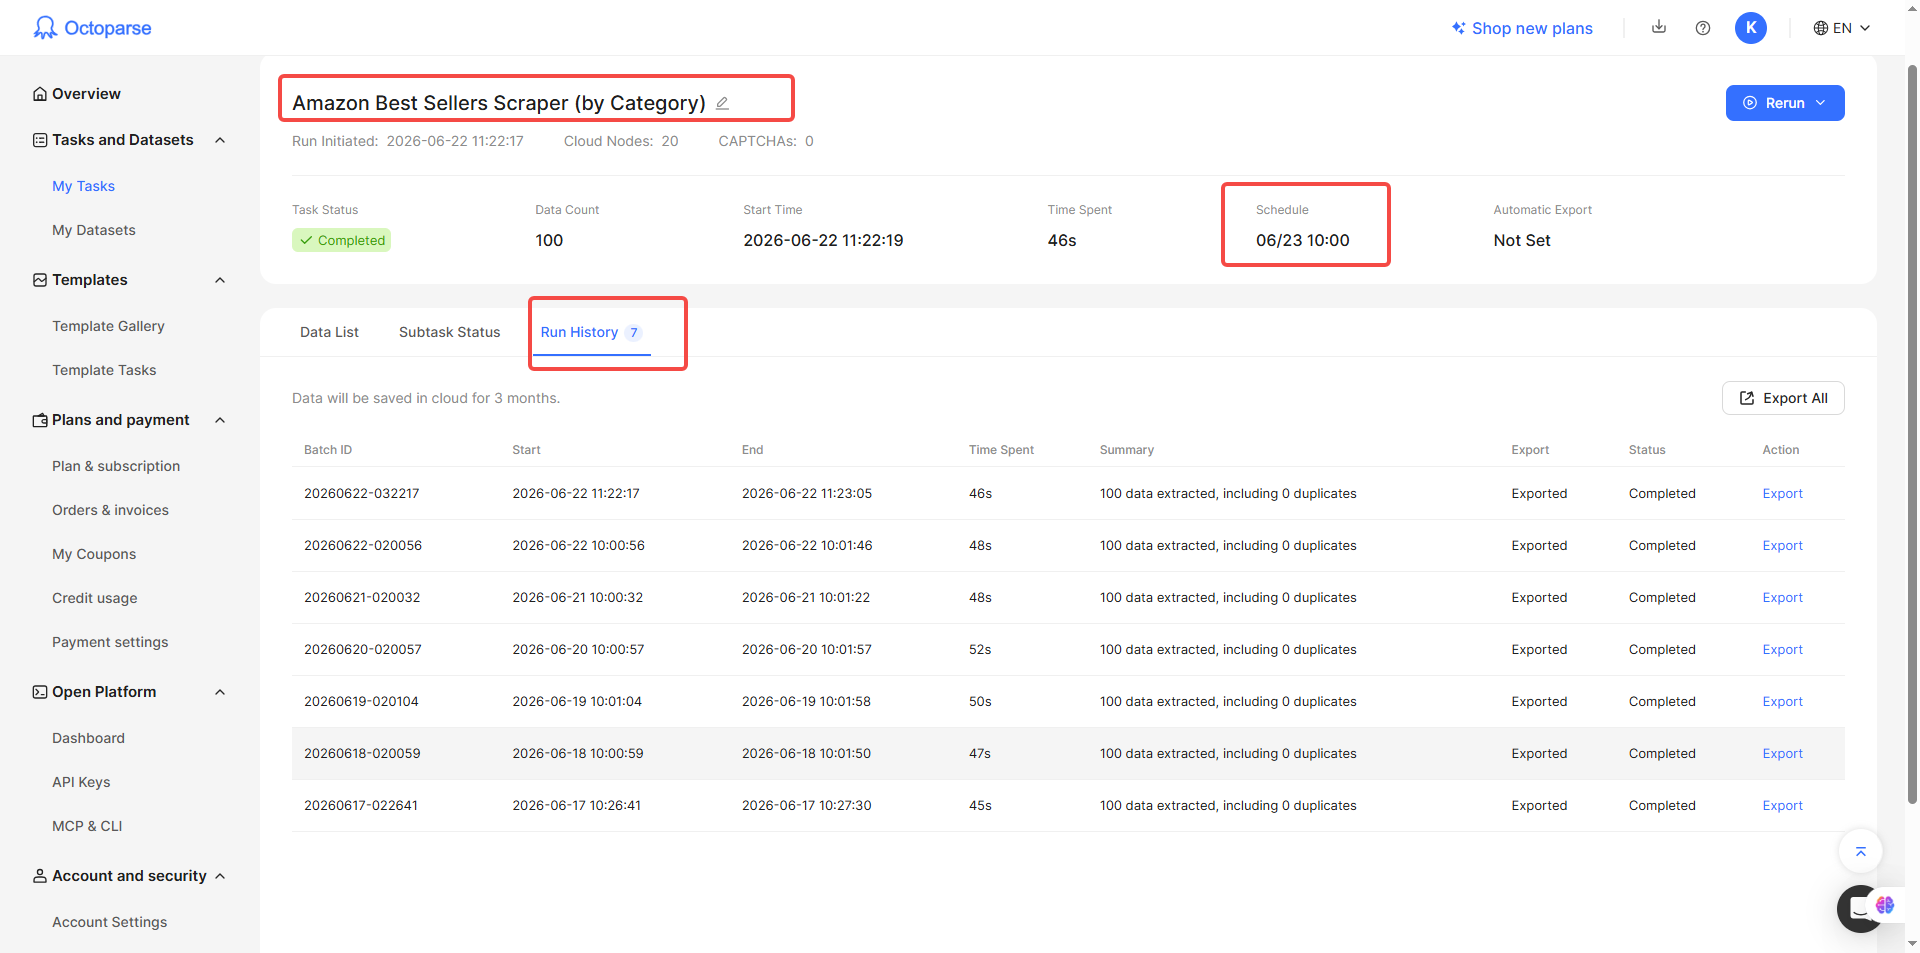
The biggest climbers over the week:
| Product | Rank movement | Net climb | Price |
| Mo Cuishle Shiatsu Back & Shoulder Massager | #62 → #21 | 41 spots | $45.99 |
| CuPiLo Foot Massager | #82 → #41 | 41 spots | $76.98 |
| RENPHO Active Thermacool Massage Gun | #85 → #52 | 33 spots | $89.99 |
| LEERCON Deep Tissue Massage Gun | #93 → #60 | 33 spots | $18.49 |
Two things the raw rankings told us that no listicle would. First, the climbers clustered around massage and recovery devices plus Father’s Day gifting, which fit the mid-June timing precisely. The data pointed at a specific sub-direction heating up that week, not just “wellness sells.” Second, Mo Cuishle was the strongest signal because it climbed steadily across the days rather than spiking once, and it also passed a stricter test for products that rose three days in a row. A steady multi-day climb is a more reliable signal than a single jump.
That is the payoff of measuring rank movement: instead of a generic “wellness is hot,” you get a specific $45.99 product gaining real momentum right now, with room to act before it saturates.
Step 3. Cross-check momentum candidates on TikTok
Take your top climbers from Step 2 and check whether social attention is driving them, and whether that attention is still growing.
Use the TikTok Search Scraper to pull videos for the product keyword or its hashtag, then run the TikTok Video Details Scraper on the resulting URLs. The output includes view counts, like counts, comment counts, hashtags, and post dates for each video.
https://www.octoparse.com/template/tiktok-video-url-scraper
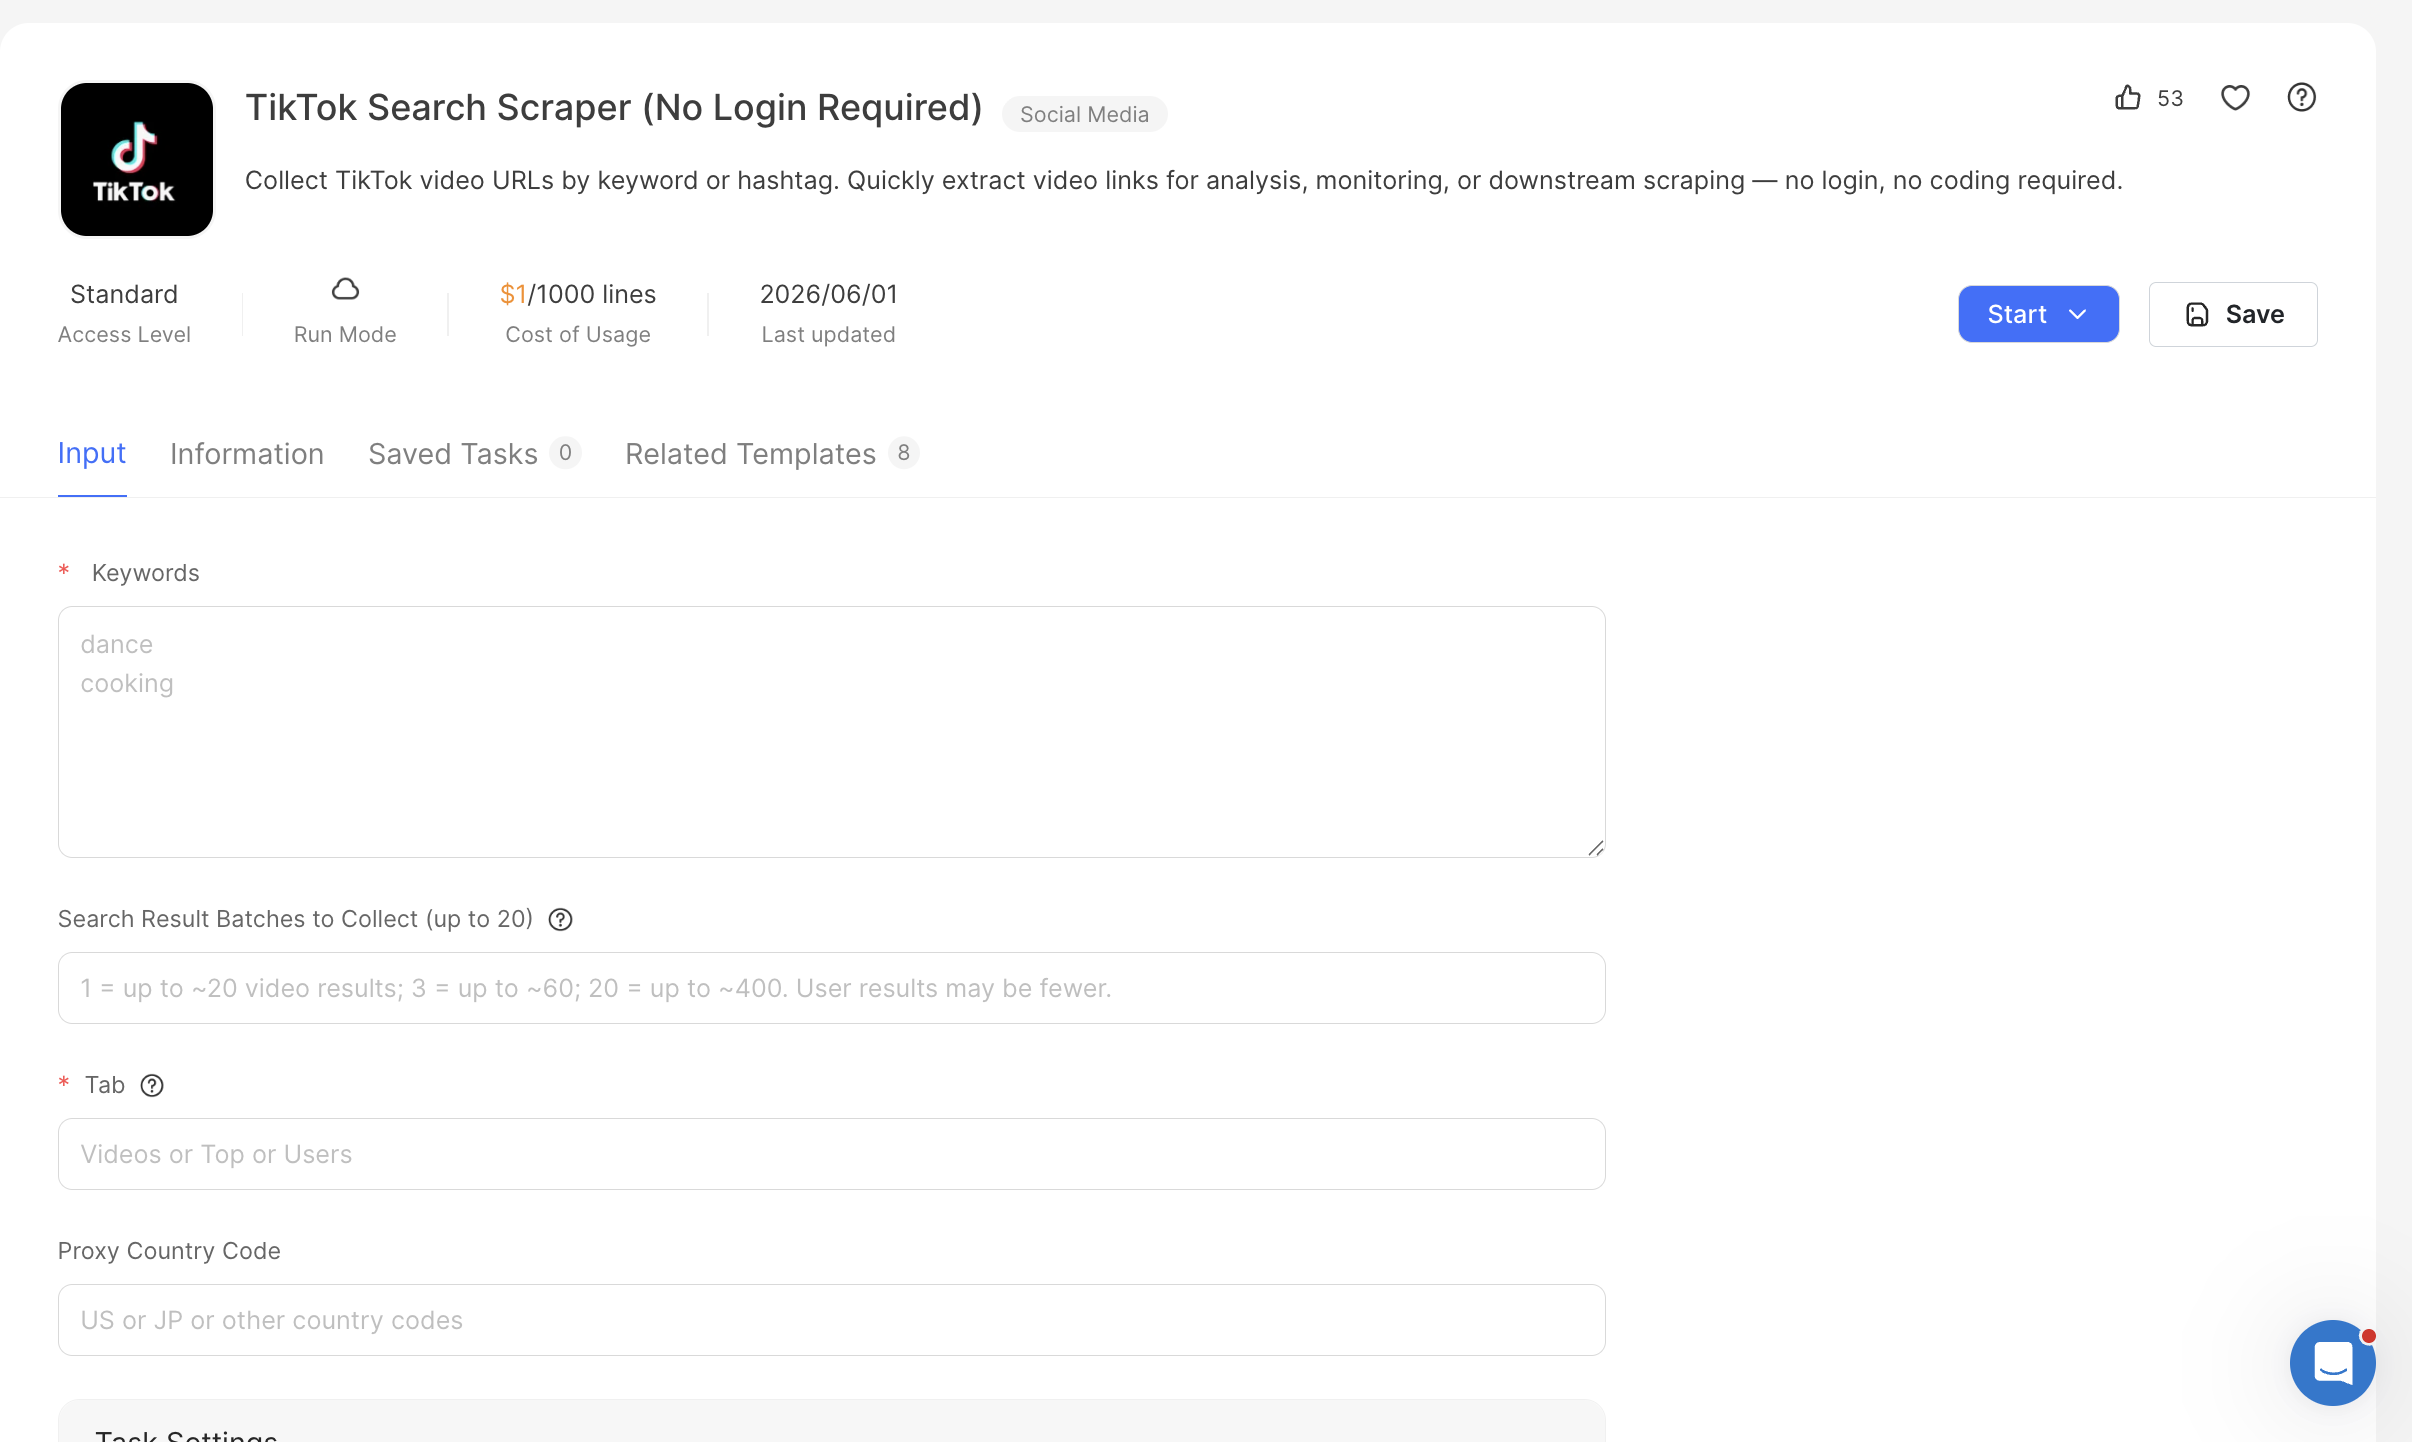
https://www.octoparse.com/template/tiktok-video-details-scraper
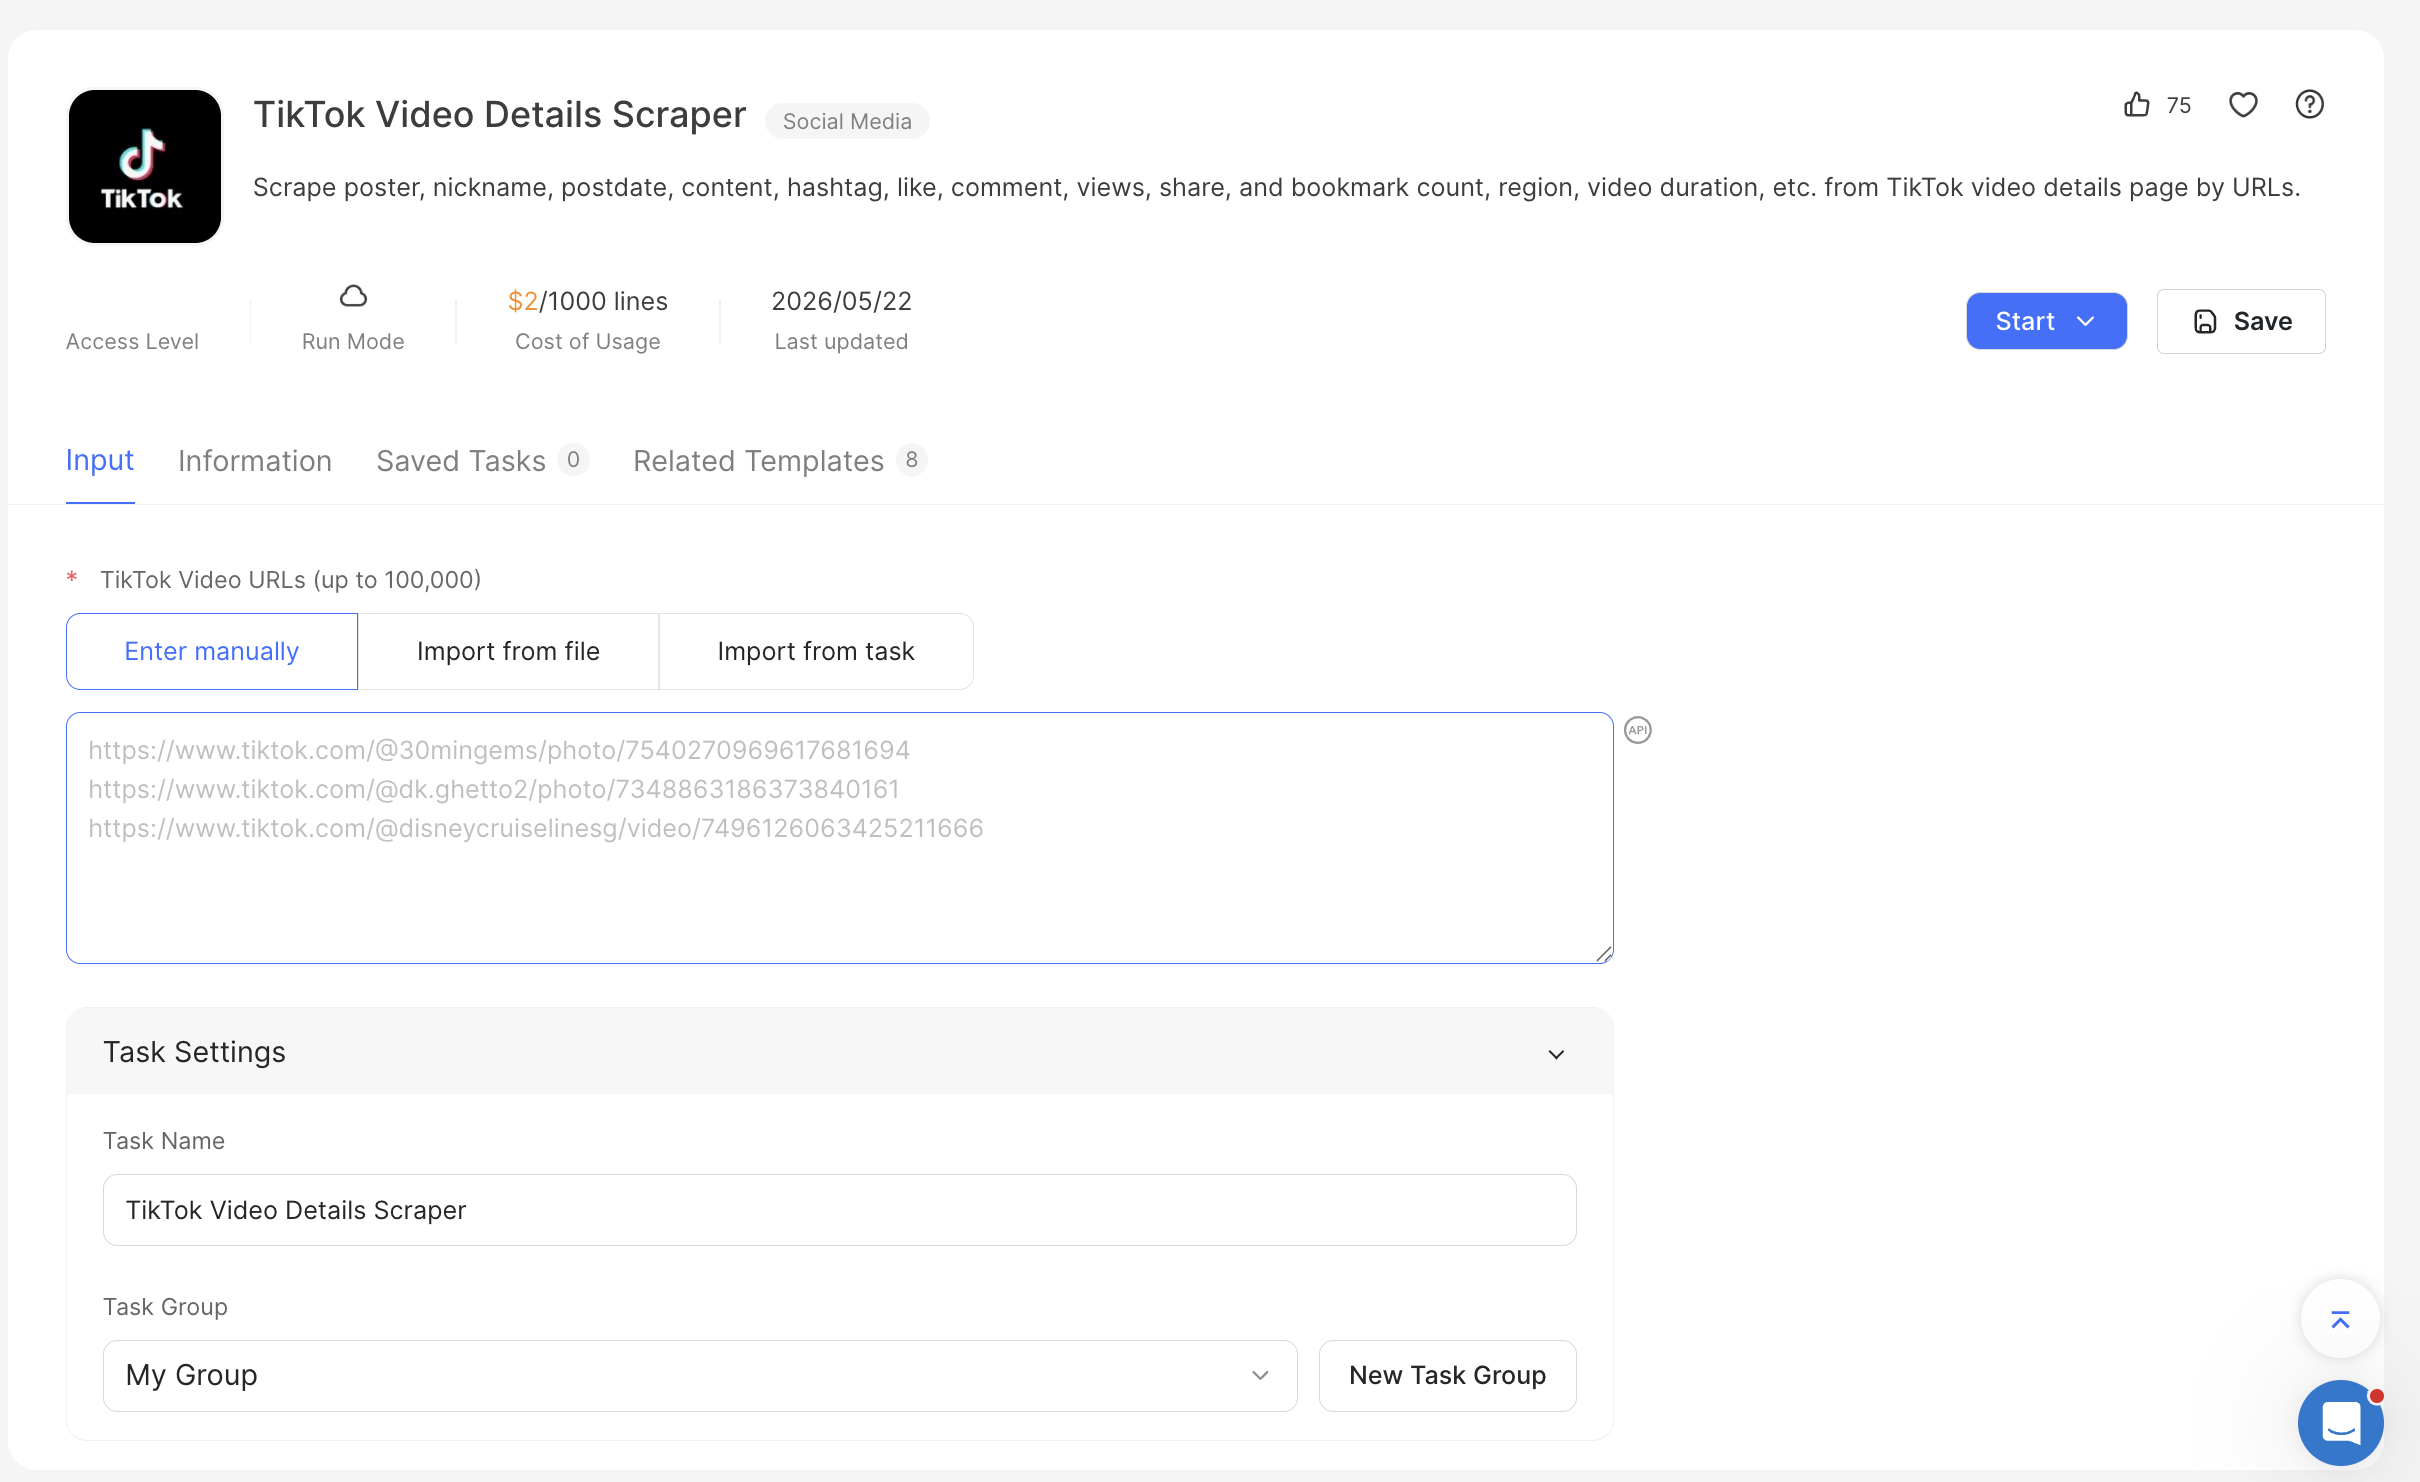
Two things to look for in that sheet:
- Recency of high-view videos. If the top videos by views were all posted months ago, the trend already peaked. If high-view videos cluster in the last two to four weeks, attention is fresh.
- Creator spread. One creator with 5 million views is a fluke. Twenty creators each pulling six-figure views is a trend.
Step 4. Validate headroom before you commit
A product with demand and momentum can still be a bad pick if the competition is already dense. Three quick checks, all from data you already scraped:
- Review counts on the Amazon listing. Climbing products with under roughly 500 reviews leave room for new entrants. Products at #5 with 40,000 reviews do not.
- Price clustering. If every ranked listing sits within a dollar of each other, the market has already raced to the bottom on price.
- Margin math. Check the supplier cost against the ranked price band. As a rule of thumb, dropshippers need enough spread to absorb ad costs and still clear a profit; if the scraped retail prices do not leave that room, move on regardless of how strong the trend looks.
Step 5. Let AI analyze the rankings for you
If you use Claude, ChatGPT, Cursor, or another MCP-compatible AI assistant, you can run this entire loop conversationally. Octoparse ships an MCP server that lets the AI search templates, launch cloud extractions, and pull results back into the chat.
In practice, that means a workflow like: ask the assistant to pull this week’s Best Sellers for your subcategories, compare against last week’s export, flag the biggest rank climbers, then fetch TikTok engagement for those products. The AI handles the joins and the delta math; you make the call on what to test. Free and Basic Octoparse accounts include 2,000 records per week through MCP, so the loop costs nothing to try.
Where Octoparse Fits in Your Product Research Stack
Most product research tools sell you their interpretation of demand data. Octoparse gives you the demand data itself, which matters for three scenarios in particular.
When the niche you sell in has no “trending products” report
Trend tools cover mainstream niches well and everything else poorly. If you sell into automotive accessories, niche pet breeds, or regional markets, the template library covers Amazon, TikTok, AliExpress, eBay, and other marketplaces, so you can build the same rank-tracking loop for whatever corner of e-commerce you actually operate in.

When you need trend history that no tool sells
Rank history is the moat in this method, and you can only build it by collecting snapshots over time. Scheduled cloud runs do that unattended: the extraction happens on Octoparse’s servers, on your schedule, with your computer off. Start collecting now and in a month you own a rank-movement dataset for your niche that no competitor can buy.
When you want answers, not spreadsheets
The MCP integration turns product research into a conversation. Instead of exporting files and writing lookup formulas, you ask the assistant which products climbed the most this week and why. For pricing beyond the free tier, the Standard plan starts at $83 per month; full details are on the pricing page.
You can create a free account and run your first Best Sellers extraction in a few minutes. No credit card, no code.
Common Mistakes When Hunting Winning Products
- Treating virality as validation. TikTok views measure attention. Only sales rankings measure purchases. Always confirm social signals against marketplace data.
- Looking at ranks once. A single snapshot cannot distinguish a rising star from an entrenched incumbent. The delta between snapshots is the signal.
- Copying public lists without checking dates. Most “winning products 2026” lists recycle each other. If you can find the product on a list, assume the easy margin is gone and verify momentum yourself.
- Skipping the margin check. A trending product with no room between supplier cost and the ranked price band is a trending way to lose money.
FAQ: Finding Winning Products
How do I find winning products for dropshipping for free?
Scrape Amazon Best Sellers rankings for your niche on a schedule, compare snapshots to find products climbing the charts, then confirm rising TikTok engagement for those products. Octoparse’s free plan includes 50,000 rows per month, which covers this entire workflow at no cost.
How is dropshipping product research different from general product research?
Dropshipping product research adds two constraints: you need supplier availability (usually AliExpress or a similar marketplace) and enough margin between supplier cost and market price to absorb advertising spend. The demand-analysis half is identical: prove that people are buying and that demand is growing.
Is Amazon Best Sellers data reliable for finding products to sell elsewhere?
Yes, with one caveat. Amazon rankings reflect Amazon’s customer base, which skews toward established demand. Use Best Sellers to confirm that a product sells, and TikTok or other social signals to judge whether the trend is early or late. The combination is more reliable than either source alone.
How often should I scrape Best Sellers rankings?
Daily for fast-moving niches like beauty, gadgets, and seasonal goods. Every two to three days for slower niches like home and garden. The goal is enough snapshots to compute meaningful rank deltas over a one-to-two-week window.
Can AI find winning products automatically?
AI can automate the heavy lifting: pulling rankings, comparing snapshots, and flagging climbers. Through Octoparse’s MCP server, assistants like Claude and ChatGPT can run those extractions directly. The final judgment on margin, supplier quality, and brand fit still belongs to you.
What makes a product “winning” versus just popular?
A popular product has high current sales. A winning product has rising sales and unsaturated competition, which means a new seller can still capture share. Popularity is a snapshot; winning is a trajectory. That is why tracking rank movement over time beats reading any static list.