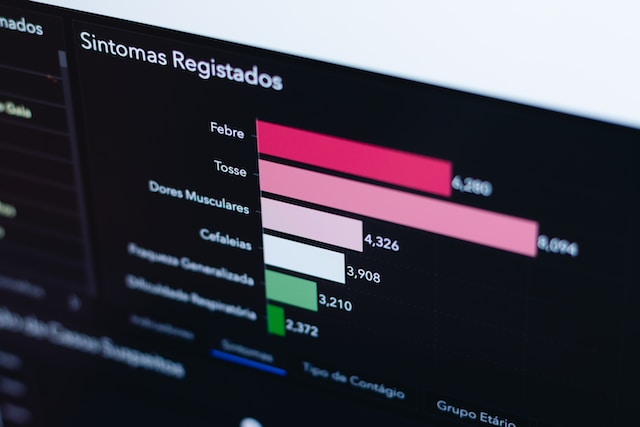
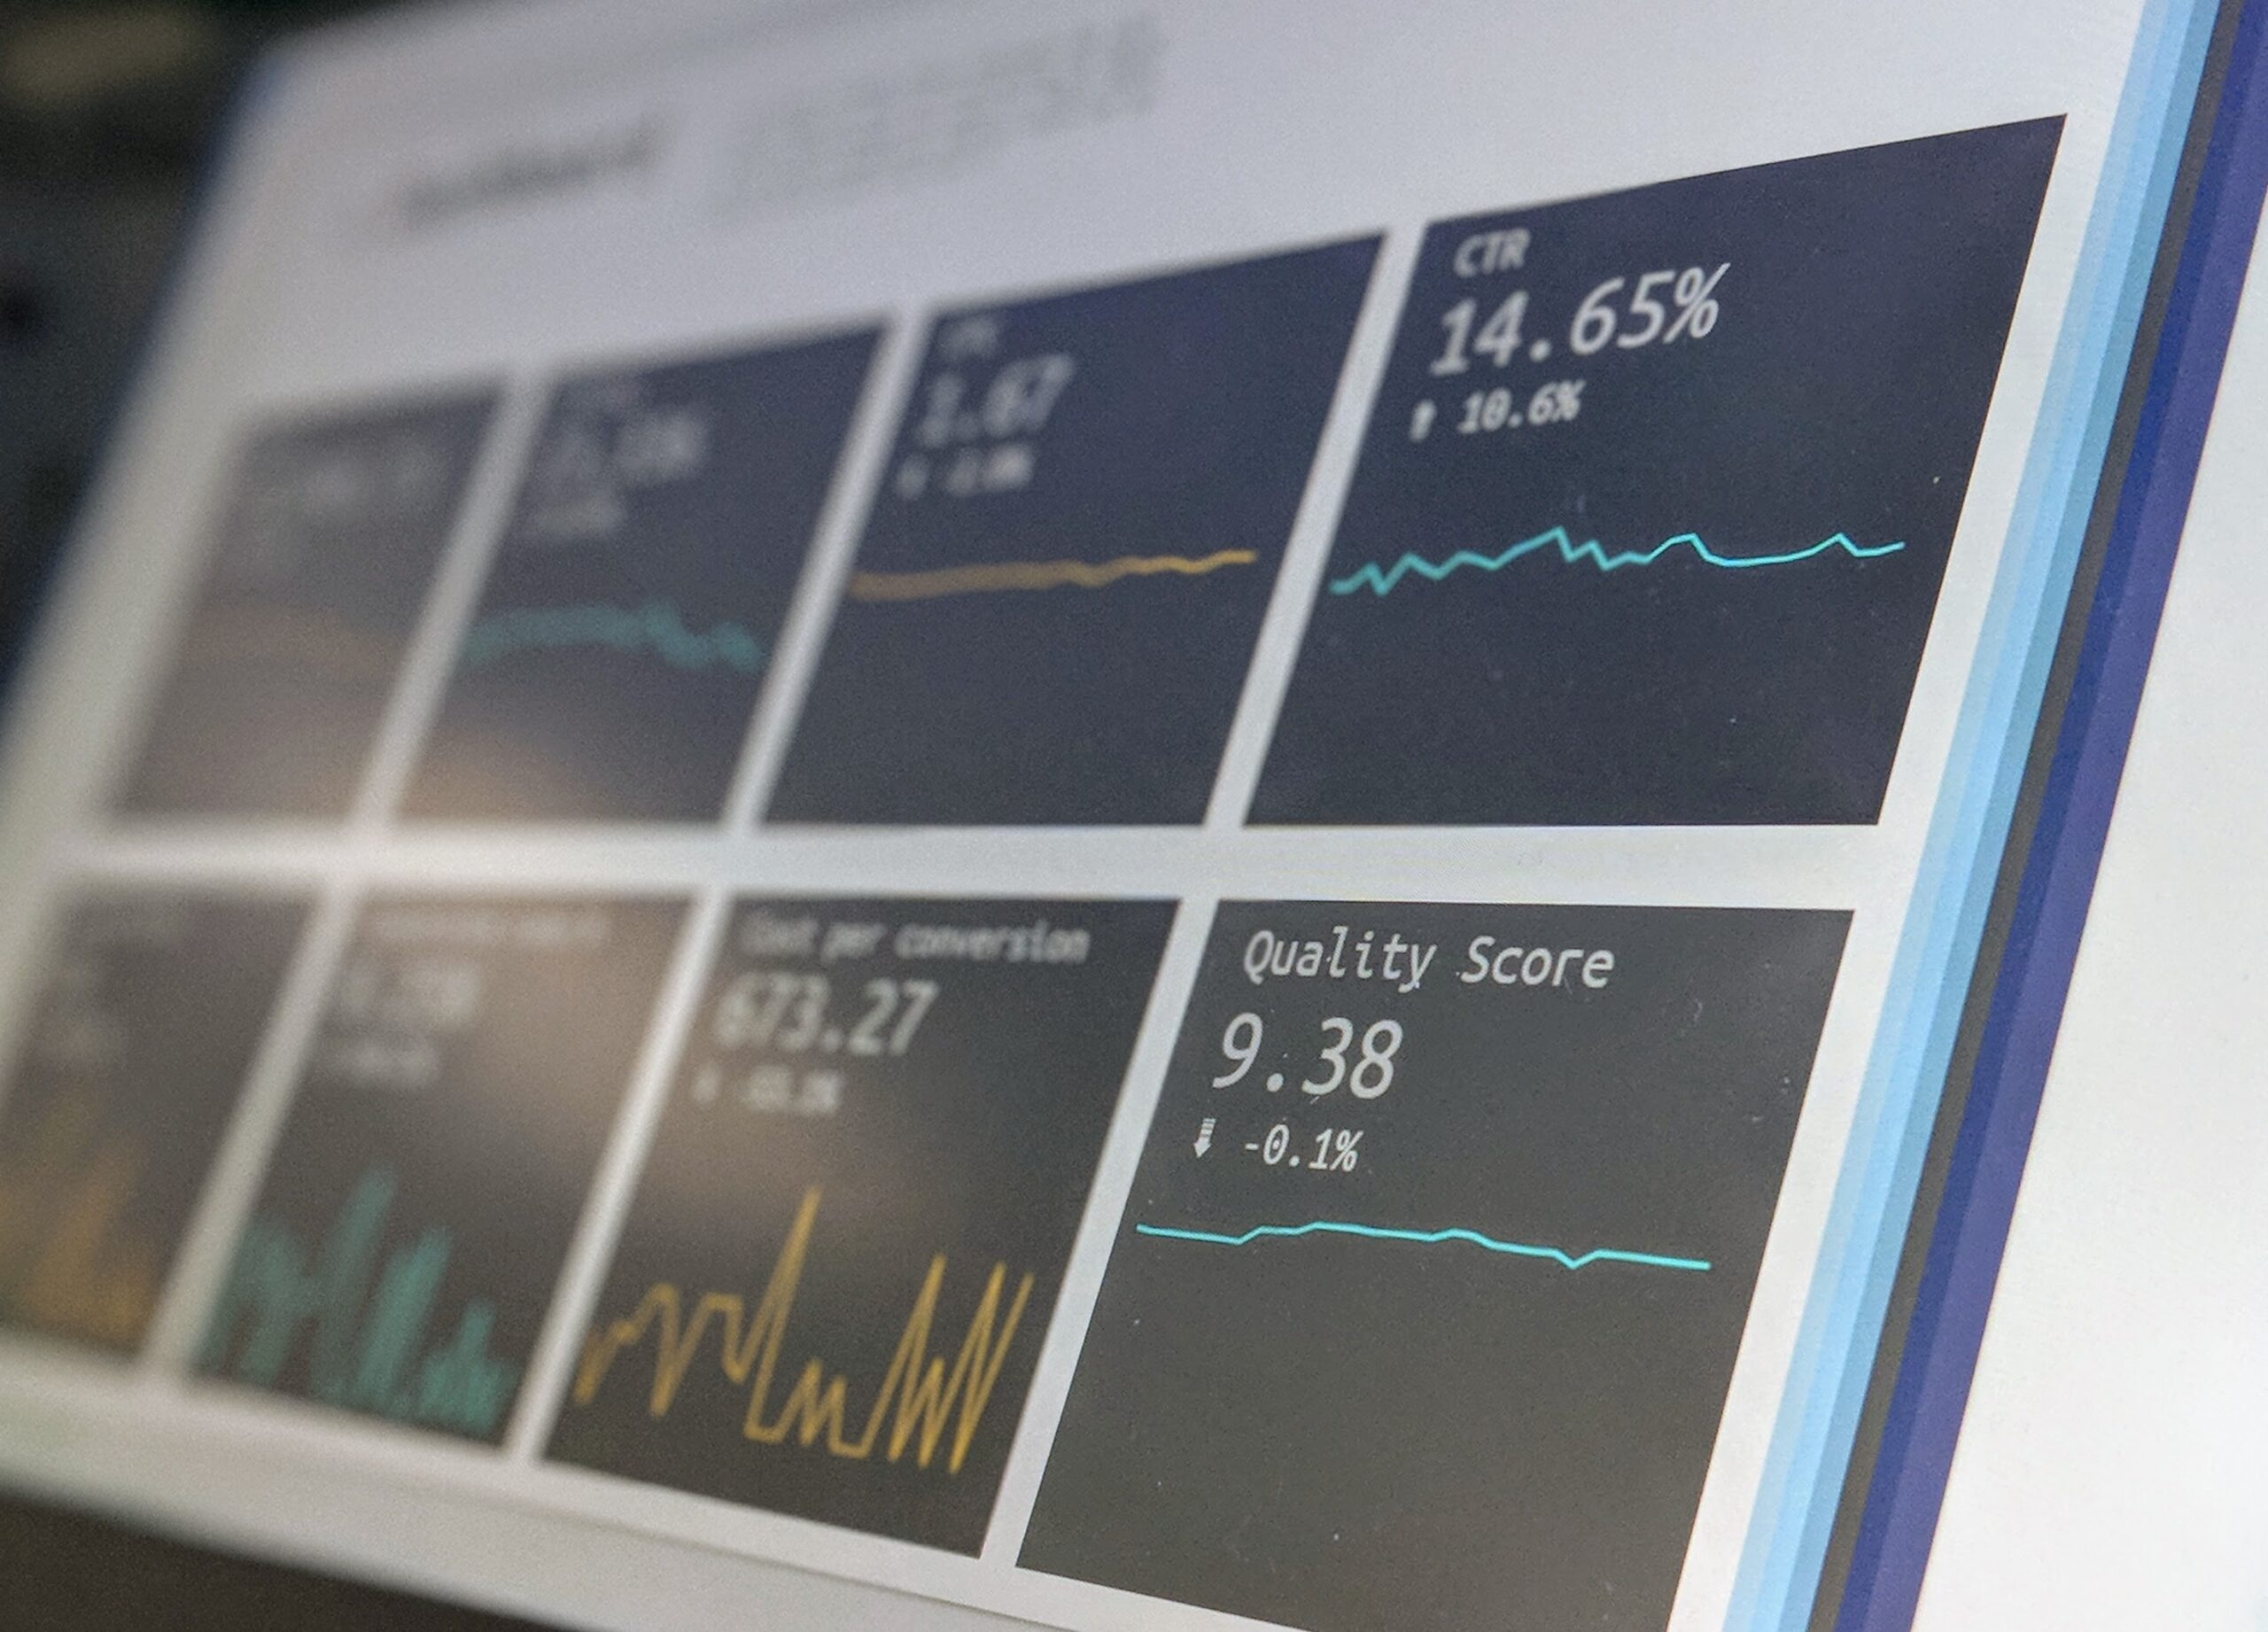
Data visualization helps present your data or information in new ways, making data easier to understand, which can contribute to the understanding of information and the efficiency of making business decisions.
A lot of data visualization tools are available with just a few clicks on Google, but the problem is how to choose the one that is most suitable for you. In 2021, we’d better know the following 10 best tools which provide better functions in accessing and presenting data.
1. Visme
Visme is an all-in-one content creation tool that allows you to create dynamic and interactive charts, graphs, and other data visualizations for your audience. From pie charts, and bar charts to maps and more, Visme allows you to input your data directly into its graph engine, or import existing Excel and Google spreadsheets into it.
Furthermore, you can create live data visualizations by connecting a publicly published Google Sheet to your chart so that each time you update your spreadsheet, your data visualization follows up instantly.
Users of Visme have access to over 30 different types of charts, graphs, and other data tools, which give them tons of options for visualizing numbers, stats, and figures.
You can get started with a free account with Visme, or upgrade to premium plans starting at $14/month, paid annually.
Visme’s data visualization tools are perfect for use in giving lectures, compiling reports, building a dynamic analytics dashboard, or delivering a presentation to your team.
2. Datawrapper
Datawrapper is a web-based tool to create charts, maps, and tables that you can embed online or export as PNG, PDF, or SVG. It’s used by thousands of people every day working for brands like The New York Times, Quartz, Fortune Magazine, Süddeutsche Zeitung, or SPIEGEL ONLINE.
The two big advantages of Datawrapper are the concise interface and the great on-brand design of the visualizations. Let’s look at both:
- Datawrapper is easy to use even if you’ve never created a chart or map before. As a web tool, Datawrapper requires no installation. You don’t need to be a coder to use it. Datawrapper leads you through a quick, simple 4-step process from uploading data to publishing your chart. This service helps you on the way. If you still have any questions in mind, Datawrapper offers >100 how-to articles and great support to you.
- Datawrapper visualizations offer professional, on-brand design and a great layout on all devices. The Datawrapper team has delved into the data visualization field for years and works as practitioners in international newsrooms such as the New York Times, NPR, Deutsche Welle, Bloomberg, Correctiv, and ZEIT Online. They know good chart design. Datawrapper’s design defaults keep your visualizations easy to understand. Your charts will be visually delightful and readable on desktops, tablets, and smartphones, in your reports, or in print. And you can create a custom design theme so that everyone on your team creates white-labeled visualizations in your brand design.
Datawrapper offers three plans:
- Create and publish unlimited charts, maps & tables, export them as PNGs, and collaborate in teams for free.
- With the Custom plan for $599/month, your visualizations will come in your company design and you can export them as PDFs and SVGs.
- The Enterprise plan includes on-premise installations, custom chart types, support & SLA agreements, and self-hosting.
User scenario
Datawrapper is used by print and online newsrooms, financial institutions, government departments, think tanks, and universities. Learn…
- how a stats office in Belgium uses it to make statistics a public good
- how the biggest newspaper in Norway transitioned from print to digital-first with Datawrapper
- why a D.C.-based think tank switched to Datawrapper after building an internal charting tool
3.FineReport
FineReport is a smart reporting and dashboard software designed for enterprises to meet the visualization needs in business.
The advantage of FineReport
- FineReport provides impressive self-developed HTML5 charts that can be smoothly displayed on any website or cool 3D web page with dynamic effects. It adapts to any screen size, from TVs and large screens to mobile devices.
- Besides the real-time display, the innovative data entry function allows you to input the data directly into the databases via online forms so as to collect data and update your databases.
- As 100% Java software, it is compatible with any business system and helps you integrate and visualize your business data in a comprehensive manner.
The prices of the product and service
- For personal use, FineReport is free without time and function limits.
- For enterprise use, FineReport is quote-based.
User scenario
- Based on the data entry and visualization features, it is convenient to integrate FineReport with other business systems to automate reports or construct business applications such as an attendance system, ordering application, etc.
- Thanks to the adaptive display, you can show KPI dashboards on TV screens at the conference, or display the cool dashboard on large screens at the industry expo.
4.FeedbackWhiz
FeedbackWhiz helps Amazon sellers increase profits and reviews.
It can monitor, manage, and automate emails, product reviews, orders, and feedback; build professional email templates using buttons, gifs, and emojis; A/B test subject lines and view open rate analytics; send or exclude emails based on triggers such as refunds, shipment, delivery, and feedback.
Instant notifications are available when reviews are posted. It helps monitor all product reviews and listings; and users will get alerts when reviews, hijackers, buy-box losses, and listing changes occur. A comprehensive profit and loss tool allows you to customize and view data for all your ASINS to get real-time accurate profits and compare them easily across all ASINs and marketplaces.
The functions – Email Automation, Listing Monitoring, Product Review Monitoring, and Profit and Loss Tool will give Amazon sellers systematic insight into their business.
FeedbackWhiz offers a Free Plan and Paid Plans depending on the package.
5. Adobe Express
The great thing about Adobe Express, a free infographic maker, is the ease of use. Without any coding or design skills, you can generate bespoke visuals that deliver information in the most engaging way with our pre-made templates. You don’t have to worry about your marketing budget, and you can remain in charge of the design process while sitting at your own desk.
6. Octoparase
Octoparse is a visualization web scraping tool. Compared with a data visualization tool, it’s pretty much a tool that helps you get data from all over the internet world. For example, if you’re an Amazon seller, you could use Octoparse to scrape Amazon product data for product selection, competitor monitoring, and so on. Of course, you can scrape recruitment information to create your own recruitment website OR application to start your own business.
Anyway, Octoparse is a handy tool to help you get all data that everyone can read online. It’s free to start. Of course, if you want to use the premium function to achieve high-speed and large-scale data scraping, you could try the premium function, starting from $89/month.
Conclusion
We are overwhelmed by boundless data. However, both small and medium-sized businesses and large enterprises need to take data management seriously thus to be able to survive in this highly competitive age. Professional, easy-to-use data visualization tools empower companies to extract actionable insights from their data. We can establish a data-driven business culture by making data analytics accessible to business users.
We hope the use of these tools can inspire you to make better business decisions and help with your business growth in the year 2020.


