The stock market must be one of the most fast-changing things in the world. It tends to react quickly to various factors, like inflation concerns and consumer spending. Especially during the pandemic, its change has been more dramatic than ever.
Investors are experiencing ups and downs. How can you make a smarter investment if you are one of them? It is likely that data will provide the useful information you need to make better decisions.
In this article, we’ll introduce how you can scrape data from the stock quotes page on Yahoo! Finance. After that, we’ll clean up the scraped data and determine how many stocks are seeing their values rise and vice versa.
Why Scrape Data from Yahoo! Finance
There are many platforms today that provide real-time stock trackers, and you can easily access these data on the web. Yahoo! Finance is one of the best-known among them. As a division of Yahoo!, it’s ranked 20th by SimilarWeb on the list of largest news and media websites.
Stock pricing data is updated dynamically on Yahoo! Finance. It allows investors to track and monitor each stock’s price, change, percent change, volume, market cap, and so on, all on one page. When we look at the page, it’s easy to see how each stock is trending. But to gain a clear picture of the entire market, for example, how many stocks are on ups or downs, we need data scraping and cleaning to help.
Extract Data – Collect Data Easily by Octoparse
Octoparse is a no-code web crawler. In this case, we’ll use it to scrape data from Yahoo! Finance. You can download and install it on your device if this is your first time using it.
Sign up for a free account if you do not have one.
4 Steps to Build a Yahoo! Finance Scraper
Step 1: Enter the URL and create a new task
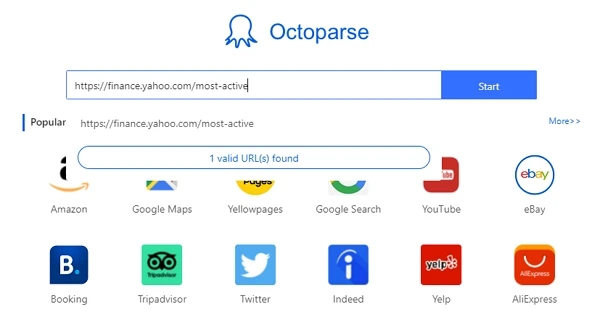
Copy the link from the Yahoo! Finance page you need to scrape. Here, we’ll use this URL https://finance.yahoo.com/most-active as an example. You can copy and paste it into the Octoparse search bar, and click on Start to create a new task.
Step 2: Launch the auto-detection process
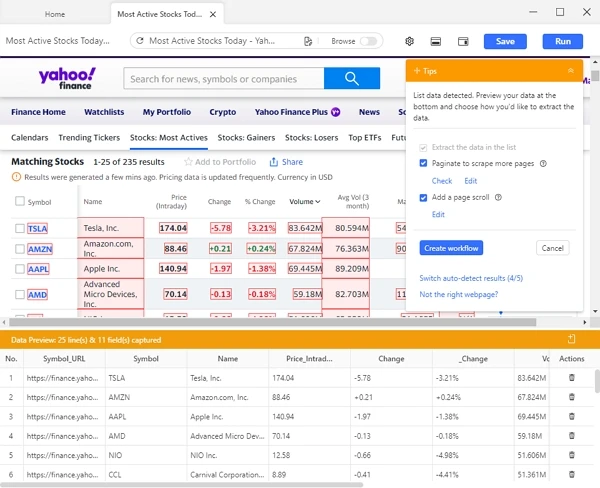
The target page will be loaded in the Octoparse built-in browser. When it has finished loading, click “Auto-detect website data” in the Tips panel to let Octoparse scan the page.
Octoparse will highlight any data that’s been detected and is ready to be extracted. If the auto-detection result does not give you what you need, you can select “Switch auto-detect results” to switch between the different sets of data that have been detected from the same page.
Step 3: Create a workflow process
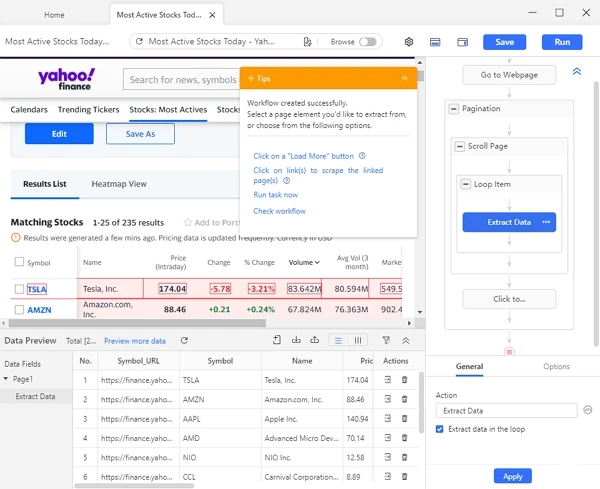
Make sure every data field you need is selected, and click “Create Workflow”. A workflow will show up on the right-hand side. It shows every step of the scraping process. You can click through the steps to see if it runs properly.
Tips
1. You should always read the workflow from top to bottom, and from inside to outside for nested actions.
2. Somehow, you might spend a lot of time building a workflow but get no data with it when you run the task. You need to troubleshoot the workflow based on the specific situation and improve the setting of each step.
Step 4: Run the workflow to extract data
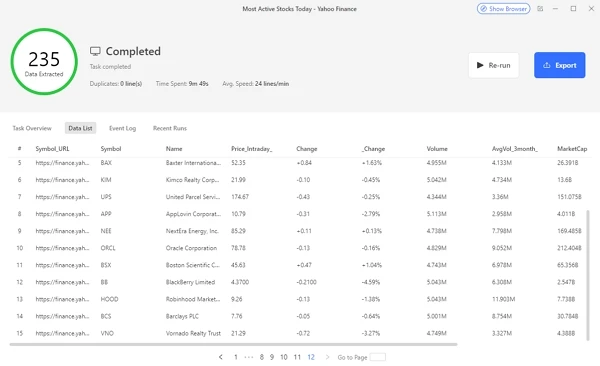
Once you’ve confirmed all the settings, click “Run” to start the extraction. Octoparse will take care of the rest and all you need to do is wait for the job to be complete. When done, you can export the extracted data to your local devices as an Excel, CSV, or JSON file.
Tips
You can choose to run the task in the cloud or on your device. Running on your local device is great for quick runs and task troubleshooting. Alternately, if you decide to execute the task on Octoparse’s cloud-based platform, 6-20 cloud servers will work on your task 24/7/365 without you having to be concerned about network outages, machine failures, or processes running slowly because of hardware restrictions.
The Best Alternative – Octoparse Preset Template
Octoparse preset templates allow users to get data with zero setup. Nowadays, there are hundreds of preset templates available on Octoparse, you can use them to grab data from most mainstream platforms on the Internet. The Yahoo Finance Scraper is one to get stock information from Yahoo Finance. It only requires Organization Stock Symbols as parameters, then you can get information including company name, sector, industry, major holders, etc.
https://www.octoparse.com/template/yahoo-finance-scraper
Clean Data – Make Sure Raw Data is Accurate and Consistent
The scraped data provides a good foundation for our analysis. Next, we’ll proceed to clean and validate the dataset to ensure that it is accurate and consistent.
QuickTable is a powerful Excel alternative to clean and process large datasets. You can go to its website to learn more about it and sign up for a free account to log in.
Step 1: Upload the Scraped Data File
Sign in to QuickTable. Next, create a new project called “Yahoo Finance Data”. Then upload the scraped data file into this project.
Step 2: Extract the number in the column “MarketCap”
You will soon notice that the column “MarketCap” (market capitalization in the full name which means the total value of all a company’s shares of stock) is in a string format. For example, 30.818 billion and 1.151 trillion are written as 30.818B and 1.151T. So we’ll need to turn them into numerical values.
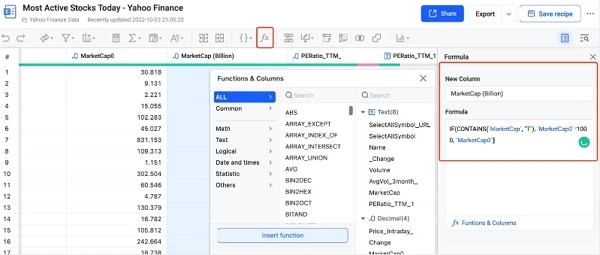
2.1 First, select Substring->Extract numbers from the Substring menu after clicking the “Text” button to convert a string value to a numerical value. The data will be entered into a column called “MarketCap0” by QuickTable.
2.2 Since one trillion is 1000 times larger than one billion, we’ll use a formula to keep the unit consistent. Click the “Formula” button and enter the customized formula in the red box to multiply 1000 to the source string end with “T”. Then, you will get a new column with a market cap scaled in billions. Now, we have finished the cleaning work.
Analyze Data – Classify Each Stock and Add Up the Number
Step 1: Tag each stock on the rise or fall
Now take a look at the column “Change”. A number bigger than 0 means the stock is going up, while a number less than 0 means the stock is trending down. We can tag the stocks as up or down.
Click the “Formula” button, and use the formula IF(‘Change’>=0, “UP”, “DOWN”) to tag each stock in a new column “UP or Down”.
Step 2: Count the number of up or down stocks
To add up the number, click “Group by”, choose Column “UP or Down” on the panel, and then click Count in the Column calculations bar. Then add the average value of “MarketCap0.” At last, press the “Save” button. In a few seconds, you’ll get the results.
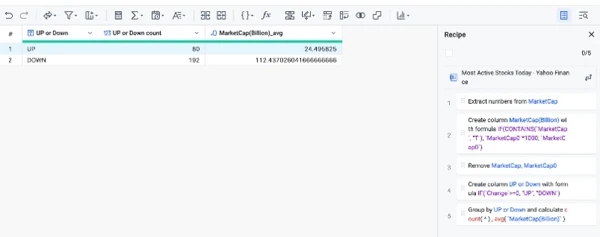
It’s obvious that the majority of stocks are going down, and their average market value is higher than the group that is growing.