Have you tried to compare the prices among your competitors on Amazon? It is definitely the right thing to do when running your e-commerce business. However, it is only a tiny part of competitor research and there’s so much you can do with the data that’s available on Amazon.
In this article, we’ll show how you can conduct competitor research on Amazon with data scraping and cleansing. Even if you are a beginner and this is your first time collecting and analyzing data, you can get it done easily by following the steps below.
To make this guide easier to follow, we’ll take Headphones & Earbuds on Amazon as an example. We’ll scrape the relevant data and find out what’s the average rating for each product under this category.
Why conduct Amazon competitor research
In short, Amazon provides just the right data to carry out competitor research. Amazon has more than 6 million sellers registered worldwide, providing more than 353 million items. You can easily view product listings, prices, ratings, reviews, discounts, etc., on Amazon. Most of this data is extractable as well.
Thus, Amazon is a great place to carry out market research. It provides a sample large enough to discover new market trends, track what your competitors are up to or learn about customer behaviours, and all these will eventually help you make smarter decisions for your business.
Extract data from Amazon using Octoparse
To get the work started, we’ll first use Octoparse to grab the data. Octoparse is a no-code web scraping tool which is very popular for online sellers to extract data from various e-commerce websites. If you have not used this tool before, please download and install it on your device first.
You can create a free account and log into the software.
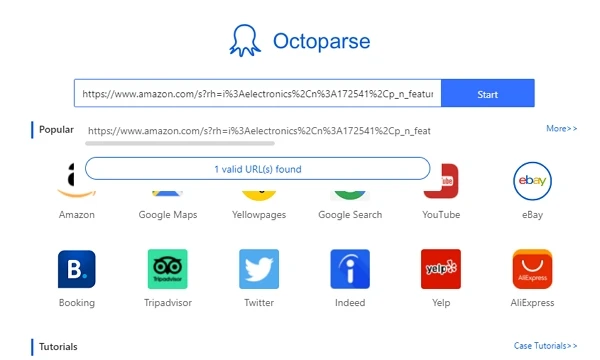
1. Click New ->Custom Task, copy the target URL below and paste it into the URL search bar. Then, click the “Save” button to create a new task.
Here is the target URL we use in this example:
https://www.amazon.com/s?rh=i%3Aelectronics%2Cn%3A172541%2Cp_n_feature_four_browse-bin%3A12097501011&ie=UTF8&lo=electronics
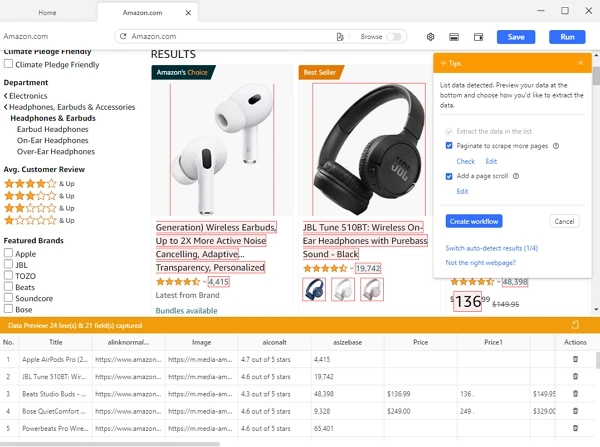
2. After you’ve successfully created a task, Octoparse will start loading the page in its built-in browser. When the loading is completed, click “Auto-detect webpage data” on the Tips panel. Octoparse will scan the page and find any data you might be interested in. The detected data will all be highlighted in red. You can modify the data fields directly in the data preview pane down below.
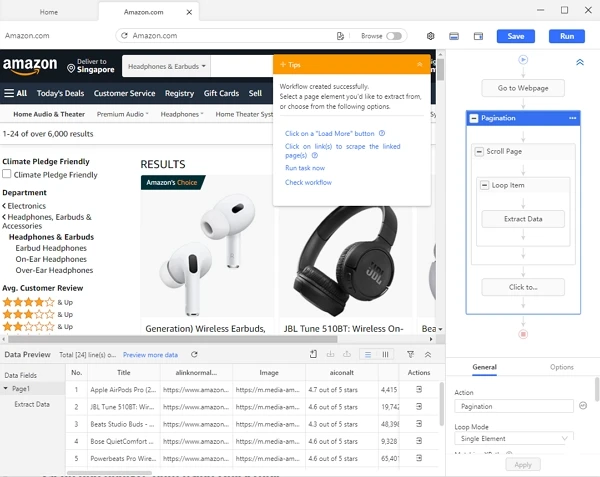
3. Click “Create workflow,” then Octoparse will build the workflow automatically. The workflow is composed of the exact steps for the bot to follow so it can find and fetch the data as needed. Always read the workflow from top to bottom and, in the case of nested actions, from inside to outside. You can click on each step to see if it works properly.
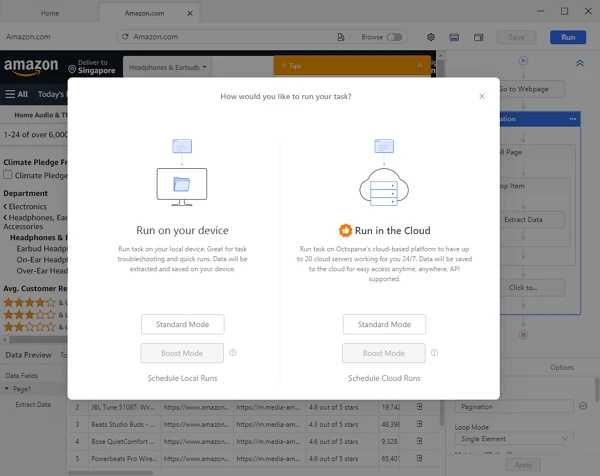
4. Once you’ve double-checked all the settings, click the “Run” button. Then Octoparse will ask if you want to run the task on your device or in the Cloud. You can go ahead with your device if it’s a quick task. By contrast, if you are going to extract data in the long term or collect a large amount of data, you are strongly recommended to go with Cloud runs, which work 24/7 around the clock.
5. When the run’s completed, you can export the data as Excel, CSV, or JSON whichever works for you.
Clean and analyze data using QuickTable
Though we have the data scraped, the data is a bit too raw to be used directly. To gain insight from this data, we still have some work to do. For the next part, we’ll use QuickTable to clean the dataset and perform some simple analysis.
QuickTable is a no-code tool for data cleaning, transforming, and analysis. You can go to QuickTable.io and sign up for a free account if you are new to the software.
Clean scraped data
1. Login QuickTable with your account, then create a new project named Amazon.
2. Upload the scraped data file to QuickTable as a new dataset. There are 49 columns when you open it in QuickTable. Let’s clean things up first because this is way beyond what we need.
3. As we want to get the average price and rating for this example, we’ll only keep the columns “Like URL1,” “asizebaseplus1,” “aiconalt,” “Price,” and “Pric”. Then rename them to “URL”, “Product”, “Stars”, “Star_counts”, “Sale_price”, and “Original_price”.
4. Looking at the data, it’s not hard to notice that the prices of some products are missing. To filter those rows, click Filter->Filter empty values->Delete empty cells.
5. With another look at the column “Original_price,” we find that some rows are empty as well. You can set the value to Sales_price in the same row. Here, we’d use a formula. Click Formula, then copy and paste the below formula into the right-side panel: IF(IS_NULL(`Original_price`),`Sales_price`,`Original_price`)
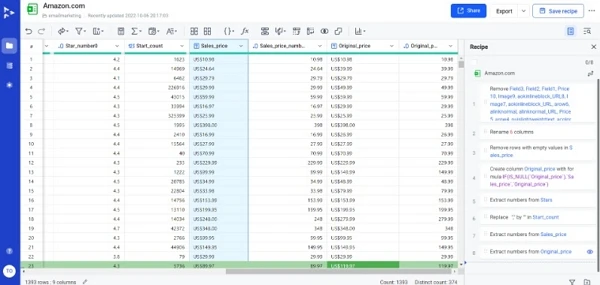
6. Now, every cell of “Sales_price” and “Original_price” has a value in it but in string format. It will not be possible to use them for calculations until we have the number values extracted. Select Format->Substring->Extract number. Next, click the “Save” button. After that, you can remove the original string columns and rename the new numerical columns.
7. Column “Stars” is a string format as well but in a somewhat more complicated situation. There are two numbers in each cell of the column. If we look closely, we only need the first number.
Click Format->Substring->Extract number as usual, but we should select “Retain 1st only” under the Resulting column on the right-side panel before the extraction. Then we will get a new column that only displays the first number of the original column. Rename it as “Star_number.”
Conduct simple research with clean data
Up till this point, we have a clean data file that can be used for various analyses.
For instance, using QuickTable’s “Group by” option, we can examine product count in terms of ratings (which are represented in the file as “Star_number”). Set the parameters as shown in the following screenshot after clicking the “Group by” button. The number of products that have the same average rating will be displayed in the result once you click the save button.
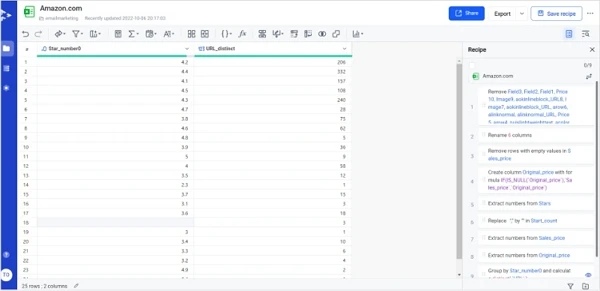
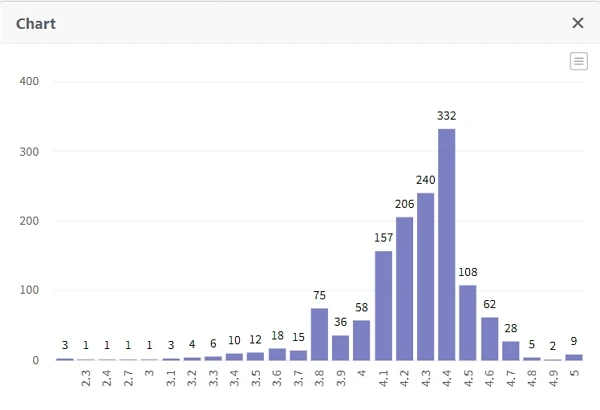
Now the result is displayed in two columns. We can create a chart that is more reader-friendly. Click Chart, choose a chart type, then define “Star_number” as X and “URL_distinct” as Y. Click the “Save” button and a chart will show up.
Looking at the chart, it is clear that most of the products have average ratings between 4.1 and 4.5 stars. It describes how the majority of products are liked under the Headphones & Earbuds category. If this is the product you are selling, you’d want to check if your products are overperforming, or underperforming when compared to the average ratings.
You can evaluate the data in the “Original price” and “Sales Price” columns by going through the same steps.
Wrap-up
Besides ratings and prices, there are many other factors we can analyze. Product names and descriptions can show us which keywords are most likely to drive traffic; monthly sales can show us what kinds of things are most popular with customers; even customer reviews can reveal what matters to them the most. All this data is extractable on most e-commerce platforms. The more data you extract from the web, the more in-depth your competitor analysis will be.