Something has changed for data journalists. In the past, information was scarce, but now, who doesn’t get crammed with that? This makes dealing with data even more critical if you want to become a data journalist. Read the following parts, you’ll learn the data journalism skills and more related skills.
What does a data journalist do?
When information was scarce, the role of a journalist was as simple as collecting and disseminating the news. Today, the flood of online data raises the threshold for journalists to sort through information. More often than not, they need to equip themselves with technical skills to be able to see through things and deliver newsworthy information to the public.
The question is, how to find the right data, and bring sense out of boundless information to the general public as a competent data journalist.
A data journalist is someone who uses statistics to facilitate the writing and reporting of news stories to provide insights based on relevant data. When searched on LinkedIn, some highlighted skills include web crawling, data visualization, analytical skills, data analytics, data mining, and so on.
Why do journalists learn to deal with data?
The words of Rebecca Borisona, a reporter at The Street best speak out of the heart of data journalists:
“I firmly believe that data makes a story better and stronger in every case. It is one thing to collect a bunch of anecdotes about a trend you think is happening, but data is a gift to any contentious story. While a source may lie to you, or spin the facts, a careful look at the data will never lead you astray. There’s power in that.”
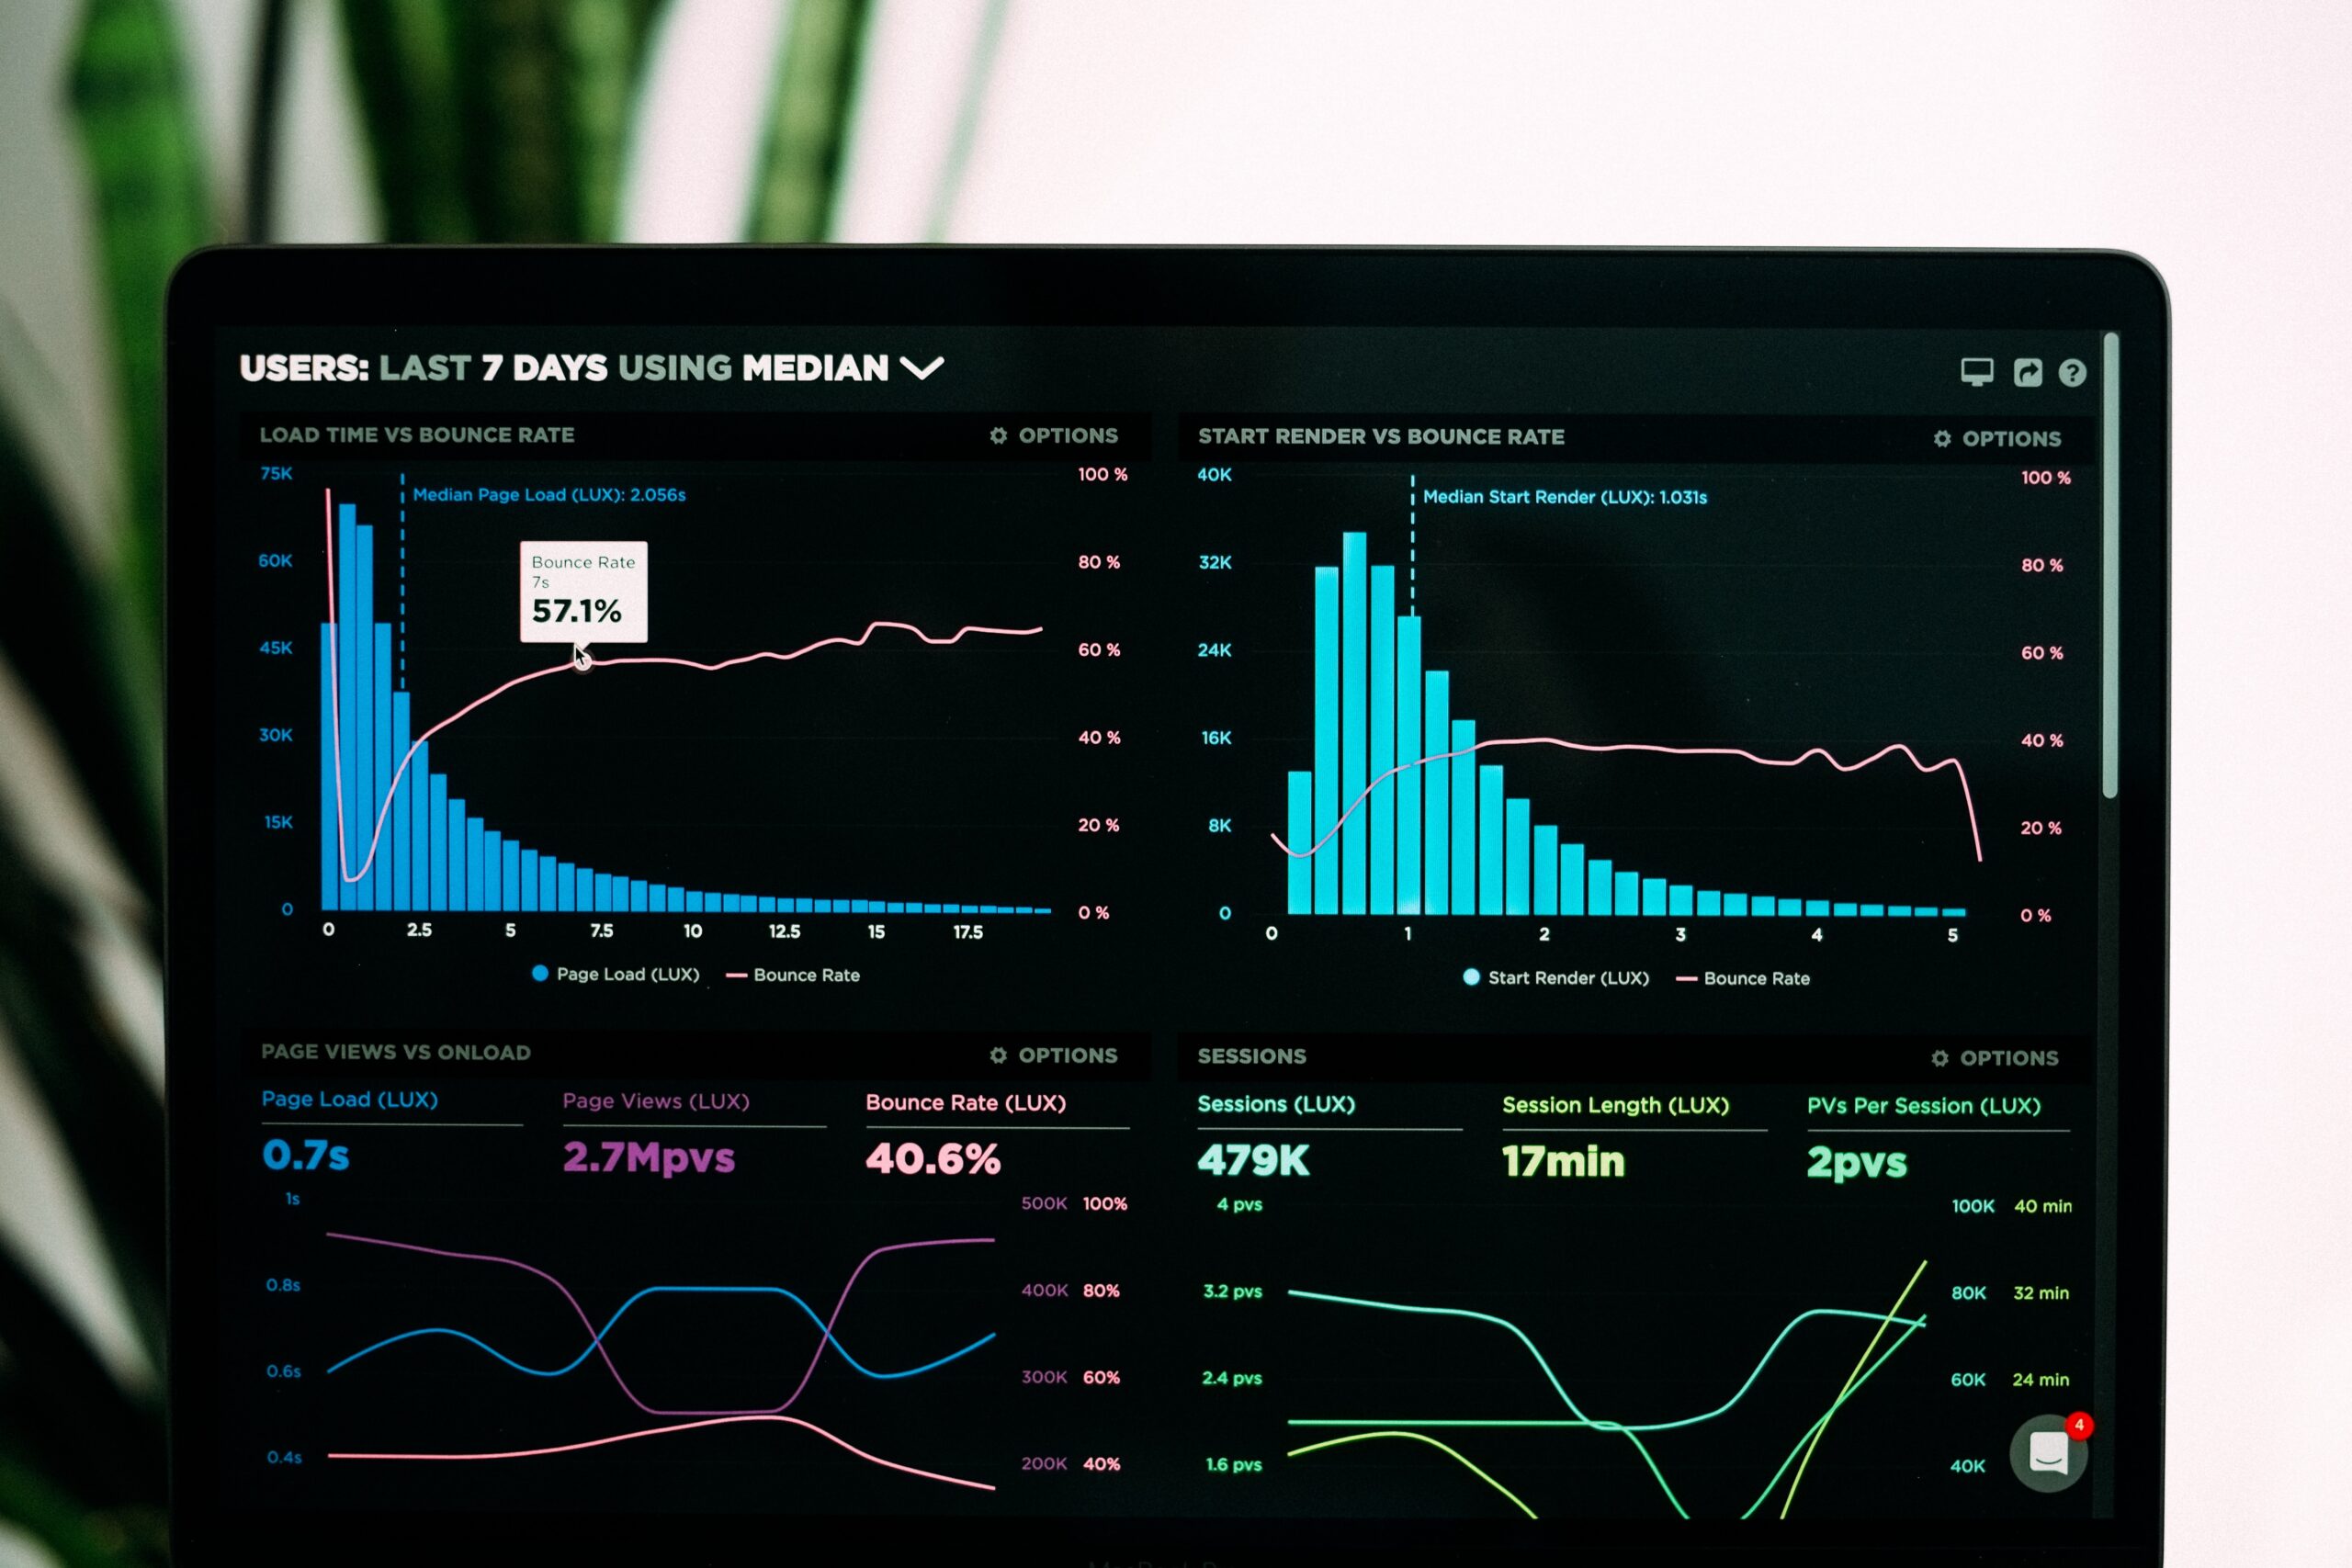
We are in a time when both rumors and facts go viral within minutes. Data, when used and analyzed properly, can help clarify rumors and reveal facts.
Data journalist Ashley did a survey during the 2019 Coronavirus outbreak. She scraped and visualized the live & death stats of COVID-19 from the Chinese government’s database, and calculated the mortality rate of the disease. The results turned out to be consistent with the official statistics of WHO, CDC, ECDE, NHC, and DXY. Data speaks for reliability.
How to break into data journalism?
Becoming a data journalist is not as difficult as we imagine. No matter what your goal is, to succeed in this field, just like in any others, the most essential part is to move forward step by step with a patient mind.
For many, the first roadblock would be “I don’t have a journalism degree” “I am not a frequent writer” or “I do write but I suck at numbers”. Well, if any of these is your case, don’t get frustrated and flee away. Because you don’t necessarily need a journalism or analytics background to start.
If you are already equipped with technical skills to obtain and process online data, that’s awesome. However, if you are a new starter dealing with data, you could consider making full use of related tools developed by those brilliant minds on the Internet. This can save you a lot of effort.
What tools are helpful for data journalists? Most companies use handy data-related tools to facilitate data analysis, for example, data extraction tools like Octoparse, data mining tools like Oracle Data Mining, and data visualization tools like Tableau and Power BI, to name a few.
None of them requires a high level of expertise. That’s why they are created: to save people a large amount of time and energy. Everyone can learn to execute data analysis from scratch.
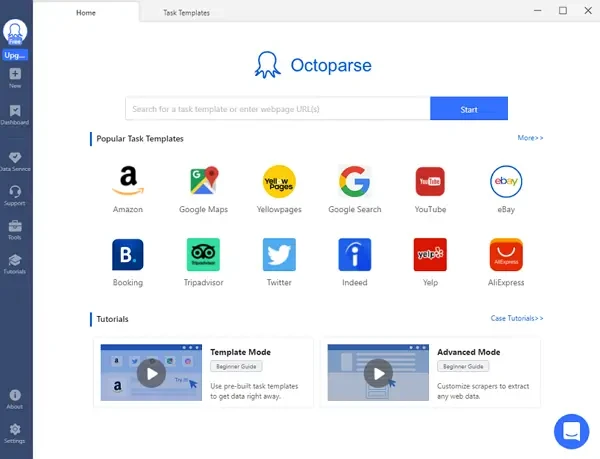
Let’s introduce more about Octoparse, a no-coding tool which can be used for data collection and data extraction:
Both experienced and inexperienced users would find it easy to use Octoparse to bulk extract information from websites, for most of scraping tasks no coding needed. Octoparse makes it easier and faster for you to get data from the web without having you to code. It will automatically extract content from almost any website and allows you to save it as clean structured data in a format of your choice. You can also turn any data into custom APIs. Now you don’t have to hire tons of interns to copy and paste manually. You just need to make the rule for collecting data and Octoparse will do the rest.
Should I learn a programming language?
Handy tools are nice, but we are not claiming that they are better just because of the convenience and relative simplicity. Skills like JavaScript, CSS, HTML, Python, Ruby web frameworks, etc., are something at the root. They are more fundamental and always worth learning. With this knowledge, you may be more adaptive to different kinds of problems and be able to come up with your own creative solutions. However, you should weigh the resources you have before making a study plan, taking into consideration your disposable time and energy. Giving up halfway can be a blow to your morale.
For non-coders: why not try a handy one?
It is often the case that data journalists need a large amount of clean and structured data to analyze and visualize. The data could be texts, images, web page URLs, numbers, or tables. To pull data from different data sources, journalists can take advantage of scraping tools. Websites are HTML codes in nature, thus to fetch data from them is realizable through a web scraper. What’s more, these tools can convert data into structured formats automatically, such as Excel, JSON, CSV, and more.
Build knowledge base about journalism
It is all about self-teaching. If you are not occupied by work and have plenty of time to kill, you can set a daily schedule for your learning. The key is to keep it as your routine. If you get off work at around 6 pm, consider putting aside a slot of time for your study and spend more time when the weekend comes. The key is to keep it as your routine. That’s how incremental improvement works its magic.
There are numerous free/paid online resources for your reference:
1. Visit the official site of The Journalism and Media Studies Centre (JMSC) of The University of Hong Kong to get the latest trend in data journalism
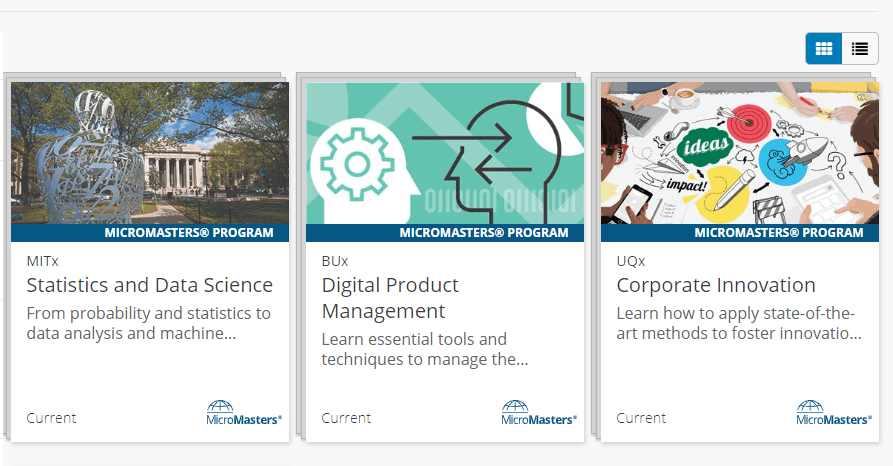
2. Attend online courses on Coursera: this can be a good company throughout your whole journey of journalism. You’ll find data journalism-related courses from top universities like MIT, UMich, and UIUC for training in statistics, data science, data visualization, programming, and so on.
3. Check out edX as another source of online courses in programming, data analysis, and statistics. They are provided in a variety of languages including English, Spanish, Chinese, Russian, French, and German.
4. If you are a fan of Google like me, you will find Google News Initiative pretty useful. On this site, they offer free online training materials for journalists, focusing on using Google tools in data journalism.
Above are just a few options for you to start exploring the world of data journalism. Another thing to keep in mind is that “Practice makes perfect”. Intensive reading and writing are inevitable in your daily practice. You will never become a good data journalist if you can’t become a good journalist in the first place.
Just roll up your sleeves, open a blank word doc or grab a pen and a piece of paper, and let your words flow! My favorite writing handbooks are On Writing Well by William Zinsser and The Elements of Style by William Strunk Jr. and E. B. White. If you are a new writer, this is a good place to start.
Be in a support system
As you are building your knowledge base and equipping yourself with all the skills, you can reach out to online data journalist communities to seek people with the same interest as you. Besides Linkedin, you can consider other great platforms for finding a job and networking with professionals such as Indeed, Mediabistro, and Glassdoor. Becoming a successful data journalist is not a piece of cake, but it is neither rocket science. As long as you are devoted to it and are passionate to find solutions for the problems you encounter, incremental improvements will take you to the destination.