In the modern economic environment, data is the glorious new oil. Data is a crucial component of business processes, and it affects how firms progress. Due to the enormous increase in data quantities being produced, it is crucial for companies to comprehend and analyze this data to identify trends and practical solutions to solve business issues.
In the consumer environment of today, data is diversified. It is produced using both structured and unstructured data formats, including movies, audio clips, photos, and social networking information. To make business decisions, this raw data has to be examined. It might be difficult for data scientists or data analysts to choose the best tool among the many available to support this data-driven decision-making process.
To assist you to pick the best data analysis tool for your needs, we will cover some popular data analysis software in this post.
What Is Data Analysis
Data analysis refers to the procedure of modifying, analyzing, and filtering raw data to obtain useful, pertinent information that supports commercial decision-making. The process offers helpful insights and data, frequently displayed in charts, graphics, spreadsheets, and graphs, which lessen the risks associated with decision-making. Thus, data analysis is essential in transforming the data into a more precise and informative structure, which enhances the work of researchers. Additionally, data analysis offers researchers a wide range of various methods, including quantitative analysis, inferential analysis, and descriptive statistics.
Difference between data mining and data analysis
Data analysis is the process of removing relevant information from data and then filtering, processing, analyzing, and presenting it to generate inferences and make decisions. Data analysis’s primary goal is to glean valuable information from the raw data, and the resulting knowledge is frequently applied to make crucial decisions.
One may classify data mining as a subcategory of data analysis. To identify significant patterns and laws, a vast body of data must be explored and analyzed. A methodical, iterative approach to finding and uncovering hidden patterns and information within a large dataset is known as data mining. It is also used to create machine learning models, which are then used in artificial intelligence.
Why is data analysis important
Data analysis identifies the parts of your company that require additional investment and resources as well as those that are underperforming and should be modified or completely removed.
Data analysis aids companies in making wise decisions and avoiding costly blunders. The likelihood of successful decision-making increases with knowledge. Business information is provided through data. The direction this development is taking is obvious.
Data is necessary if you want to make educated judgments, but there are other factors as well. The relevant data must be correct. Firms may gain pertinent, precise information through data analysis that is beneficial in developing potential promotional strategies, corporate strategies, and refocusing the organization’s vision or goal.
Best 15 Tools for Data Analysis
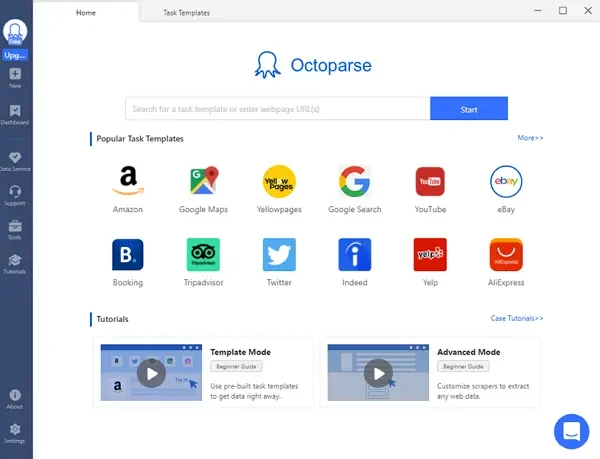
1. Octoparse
Octoparse is a web scraper that can extract data from any website easily. It asks for nothing about coding skills, you can finish the data extraction within a few clicks. With Octoparse, you can download the public data in structured formats like Excel, CSV, or your database. This will be a great help for your data analysis and cooperation works. You can find more advanced features like scheduled scraping, cloud service, IP rotation, etc.
Main Features:
- Auto-detection function helps beginners get data easily.
- Preset templates for popular sites to extract data within several clicks.
- Export web page public data to Excel files or databases.
- Works on both Windows and Mac devices.
2. MonkeyLearn
It is a no-code machine learning software that offers an extensive collection of cutting-edge data analysis tools to study unstructured data in real-time and continuously. With the help of pre-trained models, you can immediately set up MonkeyLearn to analyze big datasets, or you can use a straightforward point-and-click interface to build your unique text analysis models.
Main Features:
- You can change from data analysis to data visualization in one spot by using the in-app functionality provided by MonkeyLearn Studio.
- Connecting your existing tools and apps to MonkeyLearn’s machine learning technologies is simple thanks to native integration and a reliable API.
- A free demonstration is offered.
3. RapidMiner
Using data, businesses may create predictive machine learning models using the data science platform RapidMiner. You must have technical knowledge because it is designed for data analytics teams who wish to take on difficult jobs and manage enormous volumes of data. You may choose from a variety of options, such as TurboPrep, which enables you to filter and organize your data, AutoModel, which offers several techniques to construct machine learning models, and DataStudio, which enables you to create a graphic pipeline and examine your data, according to your requirements.
Main Features:
- It is a transparent, end-to-end data science platform that makes it possible to carry out tasks and use machine learning, and operating models.
- This software is used by industries like BMW and HP to analyze data.
4. KNIME
KNIME is an open-source, free tool for developing data science processes. You can develop sophisticated machine learning systems, import data from many sources, and display data using its user-friendly drag-and-drop interface. It has a vibrant contributor community and is often updated, like other open platforms. Even people who are not programmers may easily create workflows with KNIME.
Main Features:
- It is a free tool that is used to collect and filter data, make broadly useful components available, and develop Data Science processes.
- Organizations employ it as a framework to implement Data Science workflows and for team communication, administration, and automation.
5. Talend
Talend provides a range of cloud applications for integrating data. It’s intended to assist companies in consolidating all of their data into one interface so that teams may access the appropriate info as needed. Users of the platform may examine data without writing any code thanks to several built-in machine learning features. It makes use of algorithms for categorization, grouping, recommendations, and analysis.
Main Features:
- In addition to several paid solutions, Talend provides a free open-source version.
- Talend is used by small businesses and large corporations like ALDO, ABInBev, etc. to make important choices.
6. Excel
Microsoft Excel is the ideal tool for doing straightforward data analysis since it allows you to analyze, arrange, and display quantitative data. To combine the data you have obtained, you may utilize a variety of algorithms, filters, pivot tables, graphs, and visualizations. Excel can only manage a certain amount of data, therefore if you want to examine data at scale, you might require more robust tools.
Main Features:
- Microsoft Excel is used every day by almost all businesses to glean usable insights from data.
- Workbook Statistics allow you to take a snapshot of your workbook.
- You may add themes and premium stock photos to your papers at no charge to give them more flare.
7. Airtable
An easy-to-use cloud-based application called Airtable is described as “part spreadsheet, part database.” With a strong database at the core, it offers data analysis and data visualization features. You can quickly organize, monitor, and search data in a database by utilizing “views.” Additionally, using an API, developers may integrate Airtable with other programs.
Main Features:
- You may start with a free plan that has the fundamental features.
- Create customized user interfaces that provide each team member with the pertinent information they require and a quick method to act decisively.
8. Power BI
In the analysis phase, analytics tools like Microsoft Power BI are essential because they make it easier for businesses to find statistics, correlations, and conclusions over vast amounts of data. Users of Microsoft Power BI may drag and drop components to build real-time visualizations and reports and input data from numerous sources. With the use of artificial intelligence, an Excel interface, and pre-built and bespoke data adapters, you can gather insightful data and quickly communicate it to the rest of your staff.
Main Features:
- For customers to analyze data, link data, and safeguard data across different Office platforms, Power BI has recently developed solutions like Azure + Power BI and Office 365 + Power BI.
- International businesses like Adobe and GE Healthcare use Power BI to get the most out of their data.
9. Tableau
You can link all of your data to Tableau, a robust analytics and data visualization platform, to produce eye-catching insights and data integration that updates in real-time. It may be used both on-premises and in the cloud, supports enormous volumes of data, and is simple to use.
Main Features:
- There are many subscriptions for both individual users and businesses, as well as a free trial.
- International companies like Citibank, Skype, and Audi utilize Tableau to display their data and provide insightful findings.
- You can create visuals using the free Tableau software Tableau Public.
10. ClicData
A complex enterprise analytics platform, ClicData has several capabilities for data integration, data conversion, automation, and visualization. ClicData is entirely cloud-based and compatible with all platforms and devices. With its drag-and-drop interface, you can instantly connect, combine data from numerous sources, and create dashboards. They provide both full-service BI with in-app support and professional solutions, as well as self-service BI with online tools.
Main Features:
- In addition to four options that are suitable for mid-sized and large businesses, ClicData provides a free trial.
- It is a cloud-based application.
11. QlikView
Both on-premises and in the cloud, Qlik’s deployment options provide useful capabilities for individuals who lack basic computer literacy as well as those with extensive technical experience. In-memory data analysis is available with QlikView for incredibly instant results, and the presentation of color-coded data associations makes the outcomes and conclusions simple to interpret.
Main Features:
- A handful of the many tools and services offered by QlikView for Data Transformation, Analytics, and Developer Platforms are free for 30 days of testing.
- A handful of QlikView’s major clients are CISCO, KitchenAid, and SAMSUNG. It is acknowledged by more than 50K clients worldwide.
12. SAS Business Intelligence
The SAS Business Analytics platform places a strong emphasis on visualizations that are simple to understand and disseminate throughout an organization for data with a clear route to changing things, to increase customer happiness and increase operational efficiency.
Main Features:
- Gain understanding quickly with automated analysis supported by machine learning and clear natural language descriptions. Visually investigate all pertinent information to swiftly identify hidden linkages.
- You can instantly understand what the data is trying to tell you thanks to compelling visualizations. Everyone can grasp the descriptions for interactive visualizations supported by analytics.
13. Looker
Looker interacts with current technologies to add unique, laser-focused data that can reveal unknown data links to assist teams in making better decisions. Models have been created particularly for each customer thanks to adaptable software and apps. Additionally, a lot of their “embedded analytics solutions” are already tailored for various sectors, like commerce, medical, and more.
Main Features:
- Improve the tools you presently use by incorporating fresh, pertinent information. Your teams may come together under Looker, giving them the freedom to make decisions based on solid facts.
- Refresh your processes with current, trustworthy data. Teams may have unified access to the solutions they require with Looker, which will help them achieve their goals.
Now, for tech enthusiasts who want to develop data analysis tools, we are going to discuss two of the best and most widely used programming languages along with their features.
14. R
While developing your analysis tools utilizing open-source programming languages is an excellent choice. Data visualization, statistical modeling, and exploratory data processing are all common uses for R. It was mostly utilized at first by scientists and academics, but it has now grown into the commercial sector. Even without a foundation in programming, learning R is not too difficult.
15. Python
The ideal tool for machine learning is Python & it is one of the most popular programming languages today. It distinguishes out for being exceptionally adaptable and enabling you to create solutions for numerous use cases. Additionally, learning and writing are both quite simple.
Final Words
You must have a decent grasp of data analytics tools by this point. Also, we discuss how advanced data analysis is now simpler than ever thanks to no-code machine learning software, enabling companies to profit from vast volumes of unstructured data.