You’ve probably heard how data analysis is impacting our lives. It is much easier for businesses to analyze their customers’ behaviors and market demands with valuable data in hands. And web scraping is the best way to get web data.
Wal-Mart, in order to compete with Amazon, came up a Search Engine called “Polaris” that is based on statistic analysis and semantic analysis. Polaris can send messages about pined/liked/saved products from social media Facebook back to it. As a result, Wal-Mart gains control over consumers.
Inspired by Wal-Mart’s data-driven strategy, I analyzed the possible correlation between users’ login frequency(Frequency) and their purchase quantity(Goods). For the following, I will share instructions of how I get users data records and implement data analysis.
Step 1. Collect Rakuten Data with Web Scraping
There may be a lot of user records data in your online user management system. However, we need to export it as a more structured data set and have it stored into the local side for further analysis. For most businesses and enterprises, it can be costly to crawl data from websites by programming. Here, I can share with you the way how I crawl data from my online management system. Normally, I use Octoparse, which is an automatic web scraper/crawler that’s designed for non-programmers. We can just easily collect the target data by simple drag & click. While concerned about privacy, I can’t directly show you how to crawl my own user management site. However, I will take Rakuten.com as an example to show you how it works to crawl the target data using this free web scraping tool.
To scrape the data
Step 1: Enter the target URL
Wait for the web page gets completely loaded within the built-in browser.
Step 2: Set up the pagination loop
Octoparse will flip to next page automatically and get you a complete set of data.
Step 3: Build a loop list
Build a loop list to include all the blocks containing target data fields, just like the red box shown above.
Step 4: Select data
Begin capturing the data fields, like Name, Price, Click frequency in this example. In this case, I need the login frequency, purchased goods number and user id.
Step 5: Run the task
Click the next step by following the instructions and select “Local Extraction”. Then, you are able to see how the data is extracted in the data extraction panel within a short period of time.
Octoparse enables us to extract data to various formats including but not limited to Excel, CSV, HTML and etc. You can choose the way you’d export based on your needs.
Step 2. Implement Data Analysis
Presumption
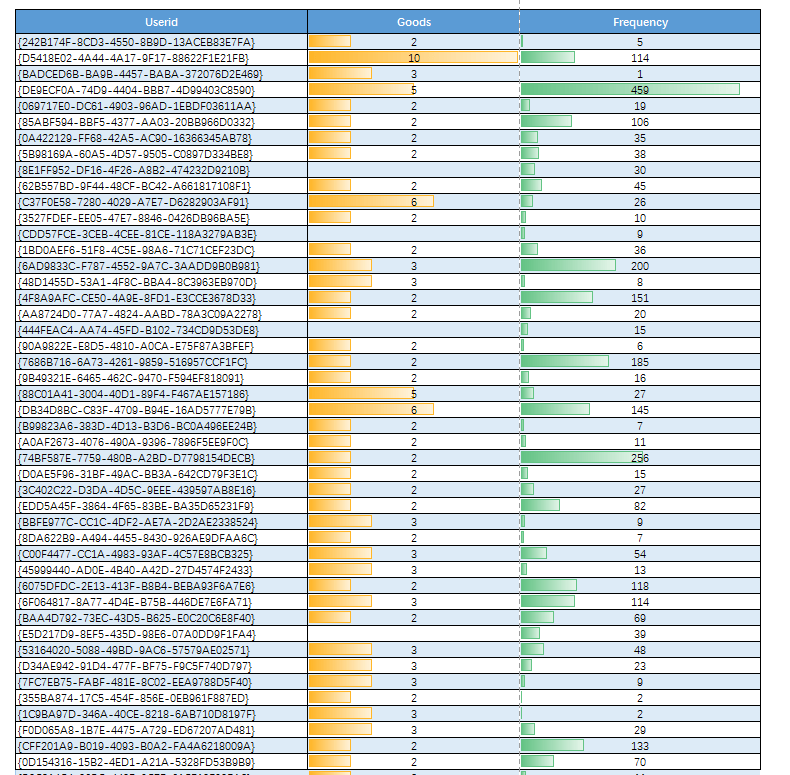
Back to my experimental case, I have exported my whole data into excel. Now, I will dig into if these two factors (Login frequency, goods number) really intertwine with one another. The data collected is reorganized and shown in the table below (Note: The table only shows parts of the data crawled).
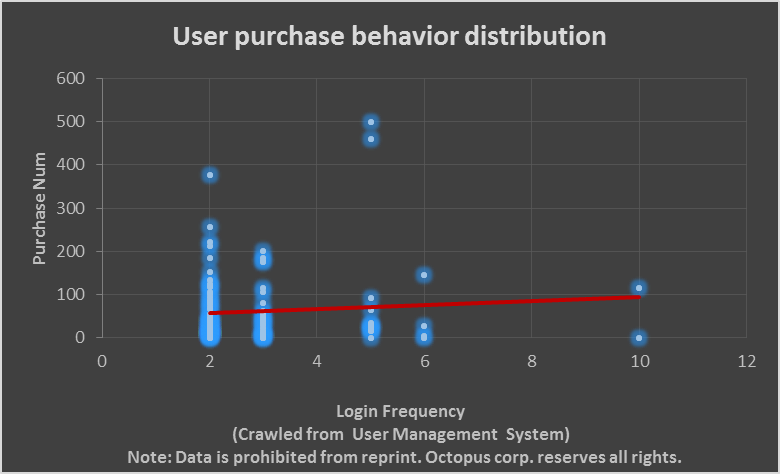
With these crawled data, we can plot a scatter diagram to observe these presumed coordinate points (Login Frequency, Purchase Num) are distributed in a regular way. The final scattered diagram is shown below. From the purchase number distribution, we can tell most scattered points have gathered between 2 and 5 around, whom we could possibly define as high-quality users.
This has assumed a scenario that people with a login frequency falling in the range between 2 and 5 may exhibit a higher inclination to purchase. Additionally, by observing the red trend line, we could presume that the higher the login frequency is within this range, the more products the customers are willing to buy. However, this is just a subjective guess. We now need to go further to test our hypothesis.
Statistical hypothesis testing analysis (P-value Approach)
Now, let’s experiment with the presumption that there might be an underlying correlation between the users’ login frequency and their purchase quantity number.
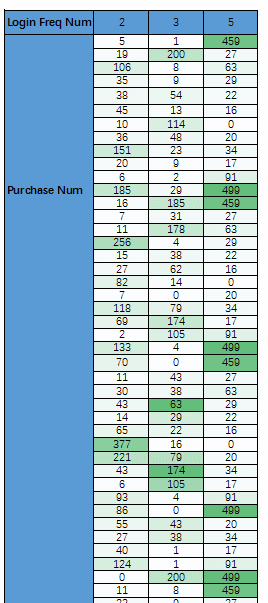
First, I have assumed that the login frequency number is within [2, 5].
Next, by sifting out 2, 3 and 5 which are the featured login frequency number, I can carry out the statistical hypothesis testing analysis.
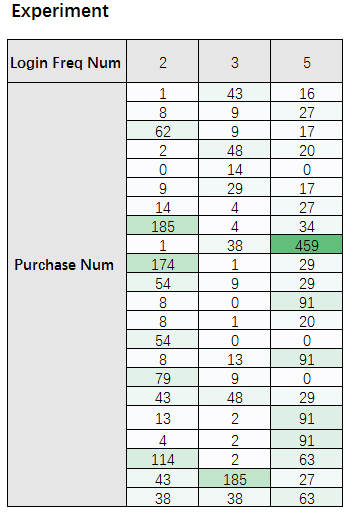
To start with, I do a random sampling from the whole data set and select 22 sample data records for the Experiment as shown in the table below.
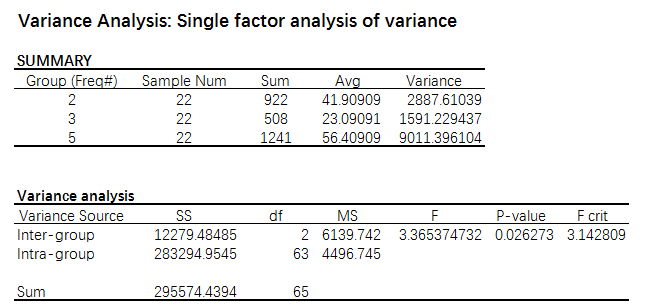
Then, you can use Matlab or any other available data analysis tools to do a single factor variance analysis. Note that we set the significance level α, the probability of making a Type I error to be 0.05.
The final result is as below. From the Variance analysis, we can see these three groups exhibit differently on Avg, thus we can specify an assumption — The sample groups difference is caused by the experiment sampling error.
Compare the P-value to α, we can see the P-value is less than α, thus we can reject the null hypothesis in favor of the alternative hypothesis that there exist difference among these three groups. Further, we can make a validation that the user purchasing quantity number is validated to be impacted by their login frequency.
From the analysis above, I am able to pay more attention to those target users with a specified login frequency, focus my goal and budget plan, also serve better for those high-quality users.